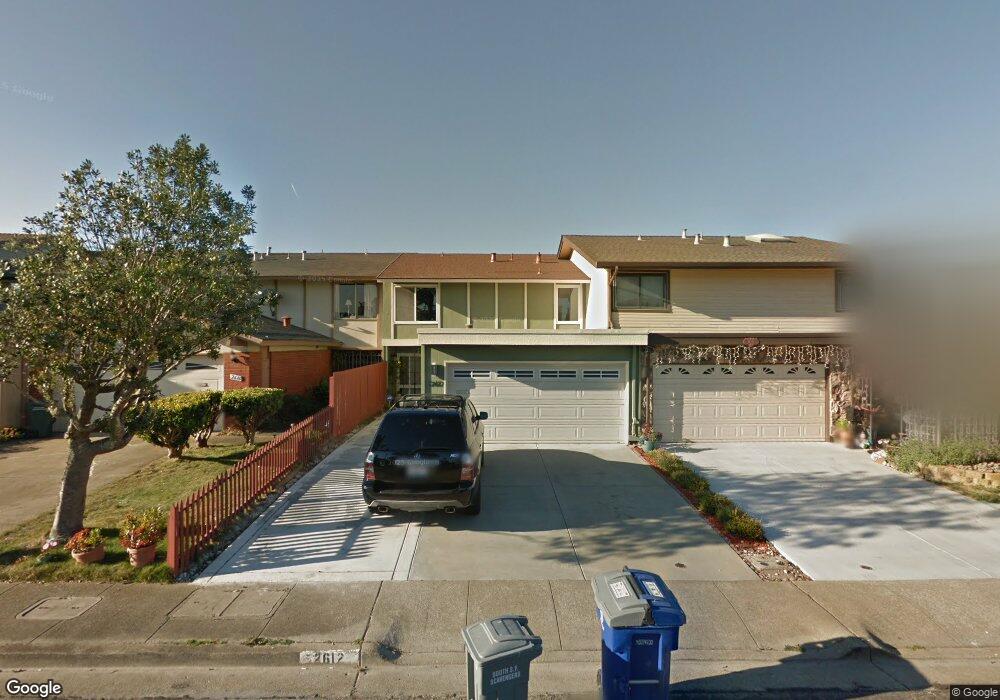
2612 Leix Way South San Francisco, CA 94080
Westborough NeighborhoodEstimated Value: $1,119,000 - $1,329,000
3
Beds
3
Baths
1,850
Sq Ft
$673/Sq Ft
Est. Value
About This Home
This home is located at 2612 Leix Way, South San Francisco, CA 94080 and is currently estimated at $1,244,335, approximately $672 per square foot. 2612 Leix Way is a home located in San Mateo County with nearby schools including Skyline Elementary School, Westborough Middle School, and South San Francisco High School.
Ownership History
Date
Name
Owned For
Owner Type
Purchase Details
Closed on
Jun 27, 2012
Sold by
Naval John Edward and Naval Angelica De Leon
Bought by
Leong Virginia Wun
Current Estimated Value
Home Financials for this Owner
Home Financials are based on the most recent Mortgage that was taken out on this home.
Original Mortgage
$306,000
Outstanding Balance
$211,926
Interest Rate
3.74%
Mortgage Type
New Conventional
Estimated Equity
$1,032,409
Purchase Details
Closed on
Jun 9, 2005
Sold by
Naval John Edward
Bought by
Naval John Edward and Naval Angelica De Leon
Purchase Details
Closed on
Oct 21, 2004
Sold by
Tonphanich Bowonrat and Tonphanich Sodsuah
Bought by
Naval John Edward
Home Financials for this Owner
Home Financials are based on the most recent Mortgage that was taken out on this home.
Original Mortgage
$520,000
Interest Rate
4.75%
Mortgage Type
Purchase Money Mortgage
Create a Home Valuation Report for This Property
The Home Valuation Report is an in-depth analysis detailing your home's value as well as a comparison with similar homes in the area
Home Values in the Area
Average Home Value in this Area
Purchase History
| Date | Buyer | Sale Price | Title Company |
|---|---|---|---|
| Leong Virginia Wun | $410,000 | Old Republic Title Company | |
| Naval John Edward | -- | Alliance Title Company | |
| Naval John Edward | $650,000 | Alliance Title Company | |
| Naval John Edward | -- | Alliance Title Company |
Source: Public Records
Mortgage History
| Date | Status | Borrower | Loan Amount |
|---|---|---|---|
| Open | Leong Virginia Wun | $306,000 | |
| Previous Owner | Naval John Edward | $520,000 | |
| Closed | Naval John Edward | $130,000 |
Source: Public Records
Tax History Compared to Growth
Tax History
| Year | Tax Paid | Tax Assessment Tax Assessment Total Assessment is a certain percentage of the fair market value that is determined by local assessors to be the total taxable value of land and additions on the property. | Land | Improvement |
|---|---|---|---|---|
| 2025 | $6,240 | $504,872 | $252,436 | $252,436 |
| 2023 | $6,240 | $485,270 | $242,635 | $242,635 |
| 2022 | $5,765 | $475,756 | $237,878 | $237,878 |
| 2021 | $5,649 | $466,428 | $233,214 | $233,214 |
| 2020 | $5,501 | $461,646 | $230,823 | $230,823 |
| 2019 | $5,442 | $452,596 | $226,298 | $226,298 |
| 2018 | $5,326 | $443,722 | $221,861 | $221,861 |
| 2017 | $5,169 | $435,022 | $217,511 | $217,511 |
| 2016 | $4,960 | $426,494 | $213,247 | $213,247 |
| 2015 | $4,862 | $420,088 | $210,044 | $210,044 |
| 2014 | $4,834 | $411,860 | $205,930 | $205,930 |
Source: Public Records
Map
Nearby Homes
- 3836 Carter Dr
- 3855 Carter Dr Unit 101
- 3885 Carter Dr Unit 307
- 2679 Sean Ct
- 672 Claridge Dr
- 2751 Duhallow Way
- 2779 Duhallow Way
- 720 Lockhaven Dr
- 3730 Bettman Way
- 3637 Bettman Way
- 3550 Carter Dr Unit 30
- 3550 Carter Dr Unit 65
- 552 Heathcliff Dr
- 532 Heathcliff Dr
- 109 Lycett Cir
- 2575 Bantry Ln
- 2504 Ardee Ln
- 37 Canterbury Ave
- 7222 Shannon Park Ct
- 3743 Radburn Dr