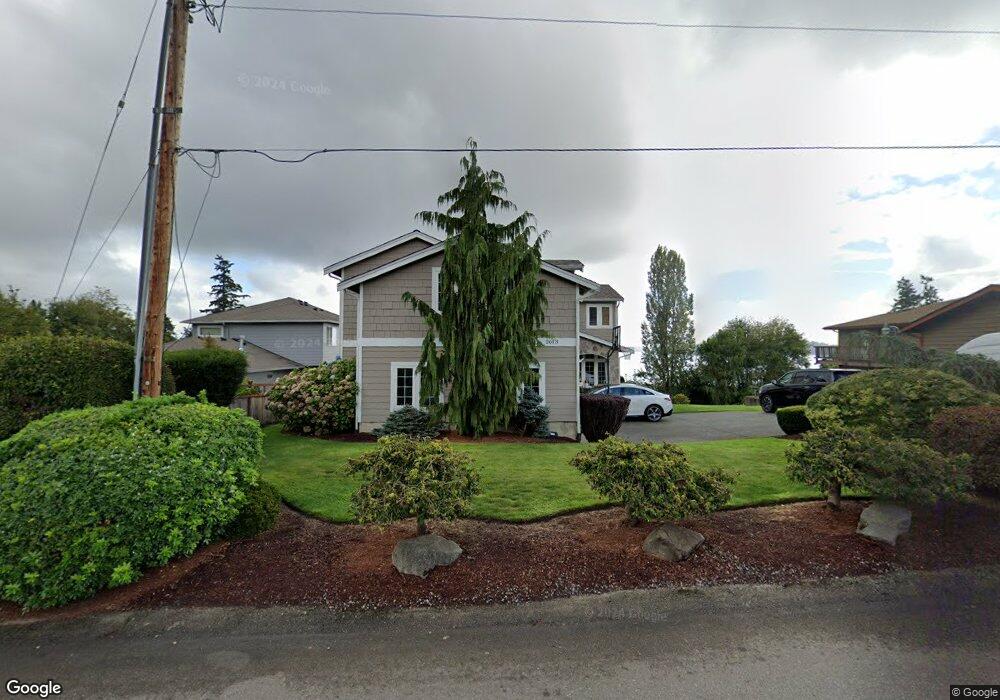
2613 2nd Ave E Port Orchard, WA 98366
Manchester NeighborhoodEstimated Value: $900,000 - $1,048,000
4
Beds
4
Baths
3,257
Sq Ft
$290/Sq Ft
Est. Value
About This Home
This home is located at 2613 2nd Ave E, Port Orchard, WA 98366 and is currently estimated at $943,633, approximately $289 per square foot. 2613 2nd Ave E is a home located in Kitsap County with nearby schools including Manchester Elementary School, John Sedgwick Middle School, and South Kitsap High School.
Ownership History
Date
Name
Owned For
Owner Type
Purchase Details
Closed on
Feb 21, 2006
Sold by
Schlatter Terrance D and Schlatter Christine A
Bought by
Flashey Hugh A and Flashey Tonya J
Current Estimated Value
Home Financials for this Owner
Home Financials are based on the most recent Mortgage that was taken out on this home.
Original Mortgage
$54,700
Interest Rate
6.08%
Mortgage Type
Stand Alone Second
Purchase Details
Closed on
Feb 3, 2004
Sold by
Grohn Larry J and Grohn Gayle M
Bought by
Schlatter Terrance D and Schlatter Christine A
Home Financials for this Owner
Home Financials are based on the most recent Mortgage that was taken out on this home.
Original Mortgage
$130,000
Interest Rate
5.82%
Mortgage Type
Seller Take Back
Create a Home Valuation Report for This Property
The Home Valuation Report is an in-depth analysis detailing your home's value as well as a comparison with similar homes in the area
Home Values in the Area
Average Home Value in this Area
Purchase History
| Date | Buyer | Sale Price | Title Company |
|---|---|---|---|
| Flashey Hugh A | $547,280 | Kitsap Title Agency | |
| Schlatter Terrance D | $225,000 | First American Title Ins |
Source: Public Records
Mortgage History
| Date | Status | Borrower | Loan Amount |
|---|---|---|---|
| Closed | Flashey Hugh A | $54,700 | |
| Open | Flashey Hugh A | $437,600 | |
| Previous Owner | Schlatter Terrance D | $130,000 |
Source: Public Records
Tax History Compared to Growth
Tax History
| Year | Tax Paid | Tax Assessment Tax Assessment Total Assessment is a certain percentage of the fair market value that is determined by local assessors to be the total taxable value of land and additions on the property. | Land | Improvement |
|---|---|---|---|---|
| 2026 | $6,996 | $817,220 | $147,850 | $669,370 |
| 2025 | $6,996 | $817,220 | $147,850 | $669,370 |
| 2024 | $6,782 | $817,220 | $147,850 | $669,370 |
| 2023 | $6,735 | $817,220 | $147,850 | $669,370 |
| 2022 | $6,436 | $653,560 | $118,070 | $535,490 |
| 2021 | $5,951 | $571,230 | $102,670 | $468,560 |
| 2020 | $6,742 | $630,610 | $92,040 | $538,570 |
| 2019 | $5,788 | $596,150 | $87,010 | $509,140 |
| 2018 | $6,059 | $463,980 | $75,500 | $388,480 |
| 2017 | $4,969 | $463,980 | $75,500 | $388,480 |
| 2016 | $4,806 | $410,360 | $71,910 | $338,450 |
| 2015 | $4,640 | $401,530 | $71,910 | $329,620 |
| 2014 | -- | $382,630 | $81,510 | $301,120 |
| 2013 | -- | $382,630 | $81,510 | $301,120 |
Source: Public Records
Map
Nearby Homes
- 7940 Beach Dr E
- 8095 E Daniels Loop
- 2372 Valley Ave E
- 8471 E Caraway Rd
- 7590 E Idaho St
- 7368 E Wyoming St
- 7569 E Montana St
- 7260 E Last Refuge Way
- 7041 E Washington St
- 7000 E Dakota St
- 7081 E Bullseye St
- 7058 E Nightingale St
- 7020 E Nightingale St
- 6997 E Bullseye St
- 7016 E Nightingale St
- 1630 & 1632 Colchester Dr E
- 22 Lots Ave
- 1738 Lilypad Place E
- 0 Nevada Ave & Michigan St Unit NWM2365944
- 5 Lots Lilypad Place E
- 8002 E Barsay Ln
- 2601 2nd Ave E
- 2589 2nd Ave E
- 8003 E Barsay Ln
- 8008 E Barsay Ln
- 7990 E Barsay Ln
- 8009 E Barsay Ln
- 7989 E Barsay Ln
- 2555 2nd Ave E
- 2616 2nd Ave E
- 2610 2nd Ave E
- 7904 Beach Dr E
- 2598 2nd Ave E
- 7984 E Barsay Ln
- 7910 Beach Dr E
- 7900 Beach Dr E
- 2544 2nd Ave E
- 7914 Beach Dr E
- 7983 E Barsay Ln