2613 N 8th St Fresno, CA 93703
McLane NeighborhoodEstimated Value: $310,000 - $324,000
3
Beds
2
Baths
1,266
Sq Ft
$249/Sq Ft
Est. Value
About This Home
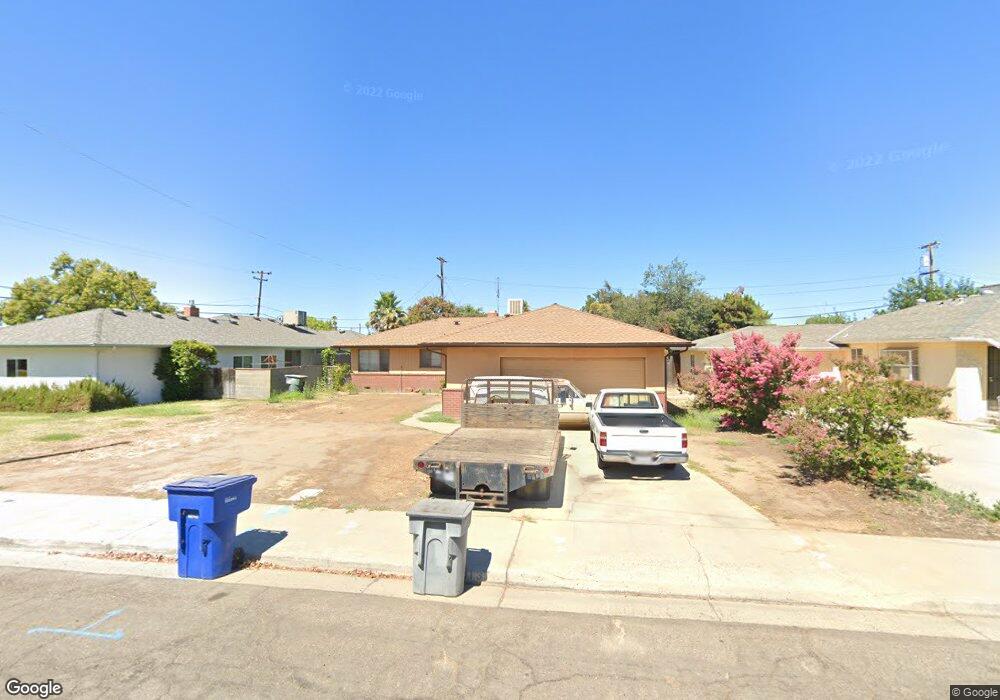
This home is located at 2613 N 8th St, Fresno, CA 93703 and is currently estimated at $315,599, approximately $249 per square foot. 2613 N 8th St is a home located in Fresno County with nearby schools including Wishon Elementary School, Scandinavian Middle School, and Mclane High School.
Create a Home Valuation Report for This Property
The Home Valuation Report is an in-depth analysis detailing your home's value as well as a comparison with similar homes in the area
Home Values in the Area
Average Home Value in this Area
Tax History Compared to Growth
Tax History
| Year | Tax Paid | Tax Assessment Tax Assessment Total Assessment is a certain percentage of the fair market value that is determined by local assessors to be the total taxable value of land and additions on the property. | Land | Improvement |
|---|---|---|---|---|
| 2025 | $767 | $59,532 | $9,203 | $50,329 |
| 2023 | $753 | $57,223 | $8,847 | $48,376 |
| 2022 | $743 | $56,102 | $8,674 | $47,428 |
| 2021 | $723 | $55,003 | $8,504 | $46,499 |
| 2020 | $720 | $54,440 | $8,417 | $46,023 |
| 2019 | $694 | $53,373 | $8,252 | $45,121 |
| 2018 | $679 | $52,328 | $8,091 | $44,237 |
| 2017 | $668 | $51,303 | $7,933 | $43,370 |
| 2016 | $647 | $50,298 | $7,778 | $42,520 |
| 2015 | $637 | $49,544 | $7,662 | $41,882 |
| 2014 | $626 | $48,574 | $7,512 | $41,062 |
Source: Public Records
Map
Nearby Homes
- 3803 E Clinton Ave
- 3514 Mayfair Dr N
- 2154 Norris Dr E
- 3415 E Terrace Ave
- 2042 Mayfair Dr E
- 3803 E Shields Ave
- 3250 E Clinton Ave
- 4054 Arden Dr S
- 2513 N 2nd St
- 3926 E Fountain Way
- 3243 E Simpson Ave
- 2414 N 1st St
- 2044 Mayfair Dr W
- 2904 N First St
- 3445 N 9th St
- 3645 E Cortland Ave
- 2136 N First St
- 3004 N First St
- 2126 N First St
- 2128 N First St
- 2623 N 8th St
- 3761 E Harvard Ave
- 2633 N 8th St
- 2614 N Millbrook Ave
- 2624 N Millbrook Ave
- 2604 N Millbrook Ave
- 2643 N 8th St
- 2634 N Millbrook Ave
- 2612 N 8th St
- 2602 N 8th St
- 2622 N 8th St
- 3766 E Harvard Ave
- 3776 E Harvard Ave
- 3756 E Harvard Ave
- 2644 N Millbrook Ave
- 2632 N 8th St
- 2703 N 8th St
- 3806 E Harvard Ave
- 3746 E Harvard Ave
- 2642 N 8th St