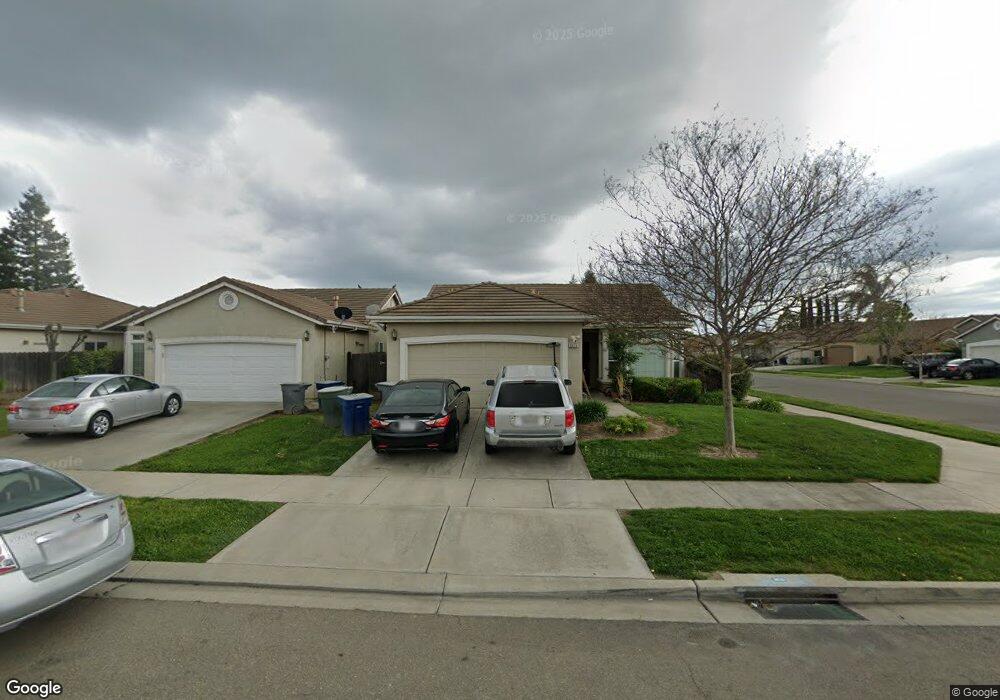
2614 Polaris Ct Merced, CA 95341
Southeast Merced NeighborhoodEstimated Value: $350,020 - $394,000
4
Beds
2
Baths
1,252
Sq Ft
$295/Sq Ft
Est. Value
About This Home
This home is located at 2614 Polaris Ct, Merced, CA 95341 and is currently estimated at $369,255, approximately $294 per square foot. 2614 Polaris Ct is a home located in Merced County with nearby schools including Pioneer Elementary School, Weaver Middle School, and Golden Valley High School.
Ownership History
Date
Name
Owned For
Owner Type
Purchase Details
Closed on
Nov 5, 2015
Sold by
Wurster Fred W and Wurster Linda J
Bought by
Fred & Linda Wurster Trust
Current Estimated Value
Purchase Details
Closed on
Jul 21, 2009
Sold by
Lionsgate Investments Llc
Bought by
Wurster Fred W and Wurster Linda J
Purchase Details
Closed on
Jun 18, 2009
Sold by
Huynh Phu
Bought by
Lionsgate Investments Llc
Purchase Details
Closed on
Oct 3, 2005
Sold by
Tovar Guillermina
Bought by
Huynh Phu
Home Financials for this Owner
Home Financials are based on the most recent Mortgage that was taken out on this home.
Original Mortgage
$276,000
Interest Rate
6.37%
Mortgage Type
Purchase Money Mortgage
Purchase Details
Closed on
Mar 18, 2004
Sold by
S & N Builders Inc
Bought by
Tovar Guillermina
Home Financials for this Owner
Home Financials are based on the most recent Mortgage that was taken out on this home.
Original Mortgage
$149,500
Interest Rate
6.87%
Mortgage Type
Purchase Money Mortgage
Create a Home Valuation Report for This Property
The Home Valuation Report is an in-depth analysis detailing your home's value as well as a comparison with similar homes in the area
Home Values in the Area
Average Home Value in this Area
Purchase History
| Date | Buyer | Sale Price | Title Company |
|---|---|---|---|
| Fred & Linda Wurster Trust | -- | None Available | |
| Wurster Fred W | $95,000 | Transcounty Title Company | |
| Lionsgate Investments Llc | $57,573 | None Available | |
| Huynh Phu | $340,000 | Alliance Title Company | |
| Tovar Guillermina | $187,000 | Transcounty Title Company |
Source: Public Records
Mortgage History
| Date | Status | Borrower | Loan Amount |
|---|---|---|---|
| Previous Owner | Huynh Phu | $276,000 | |
| Previous Owner | Tovar Guillermina | $149,500 |
Source: Public Records
Tax History Compared to Growth
Tax History
| Year | Tax Paid | Tax Assessment Tax Assessment Total Assessment is a certain percentage of the fair market value that is determined by local assessors to be the total taxable value of land and additions on the property. | Land | Improvement |
|---|---|---|---|---|
| 2025 | $1,353 | $122,612 | $25,809 | $96,803 |
| 2024 | $1,353 | $120,208 | $25,303 | $94,905 |
| 2023 | $1,322 | $117,852 | $24,807 | $93,045 |
| 2022 | $1,314 | $115,542 | $24,321 | $91,221 |
| 2021 | $1,316 | $113,278 | $23,845 | $89,433 |
| 2020 | $1,302 | $112,117 | $23,601 | $88,516 |
| 2019 | $1,278 | $109,920 | $23,139 | $86,781 |
| 2018 | $1,240 | $107,766 | $22,686 | $85,080 |
| 2017 | $1,220 | $105,654 | $22,242 | $83,412 |
| 2016 | $1,230 | $103,583 | $21,806 | $81,777 |
| 2015 | $1,195 | $102,028 | $21,479 | $80,549 |
| 2014 | $1,162 | $100,031 | $21,059 | $78,972 |
Source: Public Records
Map
Nearby Homes
- 2967 Capella Dr
- 2499 E Gerard Ave Unit 50
- 2499 E Gerard Ave Unit 96
- 2499 E Gerard Ave Unit 185
- 194 Livorno Ct
- 602 Laughlin Ln
- 2540 E Childs Ave
- 2344 Siena Ct
- 2415 E Childs Ave
- 35 River Oak Ct
- 96 River Oak Ct Unit 49 SE
- 82 River Oak Ct Unit 48 SE
- 64 River Oak Ct Unit 47 SE
- 11 River Oak Ct
- 125 River Oak Ct
- 101 River Oak Ct
- 113 River Oak Ct
- 83 River Oak Ct
- 71 River Oak Ct
- 104 River Oak Ct