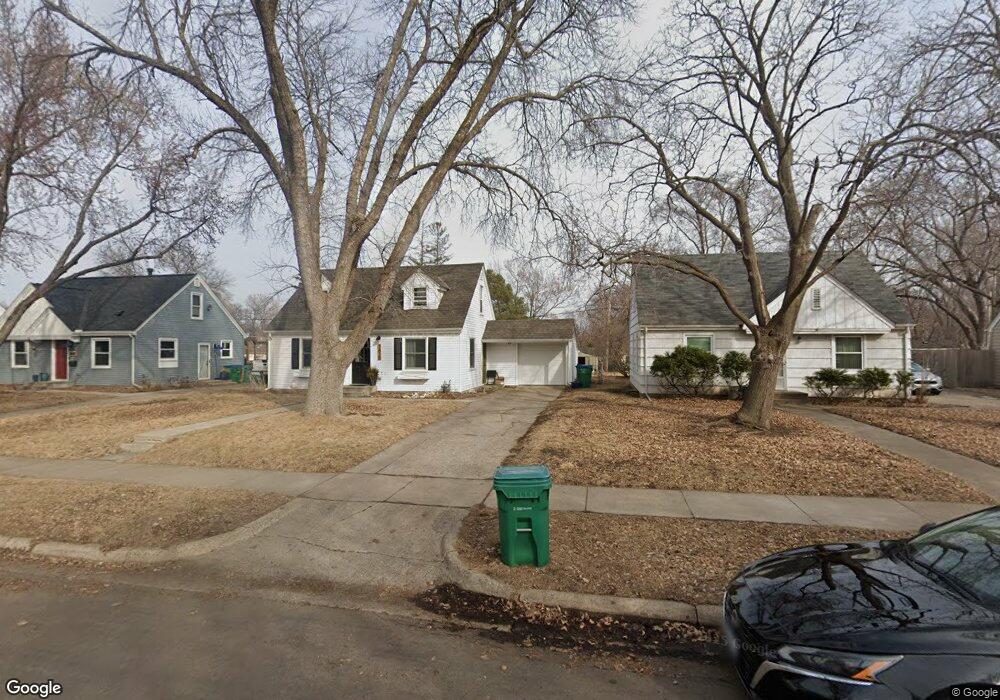
2615 Kentucky Ave S Saint Louis Park, MN 55426
Bronx Park NeighborhoodEstimated Value: $381,000 - $451,000
3
Beds
1
Bath
1,290
Sq Ft
$331/Sq Ft
Est. Value
About This Home
This home is located at 2615 Kentucky Ave S, Saint Louis Park, MN 55426 and is currently estimated at $427,505, approximately $331 per square foot. 2615 Kentucky Ave S is a home located in Hennepin County with nearby schools including Peter Hobart Elementary School, St. Louis Park Middle School, and St. Louis Park High School.
Ownership History
Date
Name
Owned For
Owner Type
Purchase Details
Closed on
Nov 25, 2020
Sold by
Pettersen and Kristen
Bought by
Honey Brothers Llc
Current Estimated Value
Purchase Details
Closed on
May 13, 2019
Sold by
Koskela Jeffrey D and Koskela Sara A
Bought by
Pettersen Joshua and Pettersen Adam
Home Financials for this Owner
Home Financials are based on the most recent Mortgage that was taken out on this home.
Original Mortgage
$260,760
Interest Rate
4%
Mortgage Type
Construction
Purchase Details
Closed on
Sep 18, 2002
Sold by
Chinyam Dorjee Phuntsok
Bought by
Koskela Jeffrey D and Koskela Sara A
Purchase Details
Closed on
Nov 12, 1998
Sold by
Baldwin Lowell F
Bought by
Dorjee Phuntsok and Tsamchoe Nyima
Purchase Details
Closed on
Jan 22, 1996
Sold by
Baldwin Lowell F
Bought by
Baldwin Steven B
Create a Home Valuation Report for This Property
The Home Valuation Report is an in-depth analysis detailing your home's value as well as a comparison with similar homes in the area
Home Values in the Area
Average Home Value in this Area
Purchase History
| Date | Buyer | Sale Price | Title Company |
|---|---|---|---|
| Honey Brothers Llc | $500 | None Listed On Document | |
| Pettersen Joshua | $260,000 | Edina Realty Title Inc | |
| Koskela Jeffrey D | $183,000 | -- | |
| Dorjee Phuntsok | $118,500 | -- | |
| Baldwin Steven B | $99,800 | -- |
Source: Public Records
Mortgage History
| Date | Status | Borrower | Loan Amount |
|---|---|---|---|
| Previous Owner | Pettersen Joshua | $260,760 |
Source: Public Records
Tax History Compared to Growth
Tax History
| Year | Tax Paid | Tax Assessment Tax Assessment Total Assessment is a certain percentage of the fair market value that is determined by local assessors to be the total taxable value of land and additions on the property. | Land | Improvement |
|---|---|---|---|---|
| 2024 | $5,795 | $412,900 | $144,100 | $268,800 |
| 2023 | $5,197 | $390,000 | $141,300 | $248,700 |
| 2022 | $4,666 | $389,300 | $140,600 | $248,700 |
| 2021 | $4,705 | $348,400 | $122,300 | $226,100 |
| 2020 | $3,820 | $340,400 | $116,500 | $223,900 |
| 2019 | $3,415 | $270,800 | $111,000 | $159,800 |
| 2018 | $3,373 | $251,100 | $105,800 | $145,300 |
| 2017 | $2,954 | $220,400 | $83,700 | $136,700 |
| 2016 | $3,161 | $226,300 | $75,600 | $150,700 |
| 2015 | $2,954 | $207,700 | $70,700 | $137,000 |
| 2014 | -- | $191,100 | $67,100 | $124,000 |
Source: Public Records
Map
Nearby Homes
- 2620 Kentucky Ave S
- 2608 Kentucky Ave S
- 2622 Idaho Ave S
- 6926 W 24th St
- 2732 Idaho Ave S
- 6821 W 24th St
- 2700 Georgia Ave S
- 7009 Cedar Lake Rd S
- 2849 Jersey Ave S
- 2852 Hampshire Ave S
- 2575 Quebec Ave S
- 2707 Edgewood Ave S
- 2744 Dakota Ave S
- 2054 Louisiana Ave S
- 2925 Georgia Ave S
- 7217 Minnetonka Blvd
- 2910 Edgewood Ave S
- 2016 Kentucky Ave S
- 7907 W 25th St
- 7414 W 22nd St Unit 114
- 2611 Kentucky Ave S
- 2621 Kentucky Ave S
- 2620 2620 Kentucky-Avenue-s
- 2605 Kentucky Ave S
- 2625 Kentucky Ave S
- 2624 2624 Kentucky Ave S
- 2614 Jersey Ave S
- 2610 Jersey Ave S
- 2620 Jersey Ave S
- 2601 Kentucky Ave S
- 2631 Kentucky Ave S
- 2601 Kentucky Ave S
- 2624 Jersey Ave S
- 2600 Jersey Ave S
- 2631 2631 Kentucky-Avenue-s
- 2616 Kentucky Ave S
- 2612 Kentucky Ave S
- 2600 Jersey Ave S
- 2624 Kentucky Ave S
- 2632 2632 Kentucky Ave S