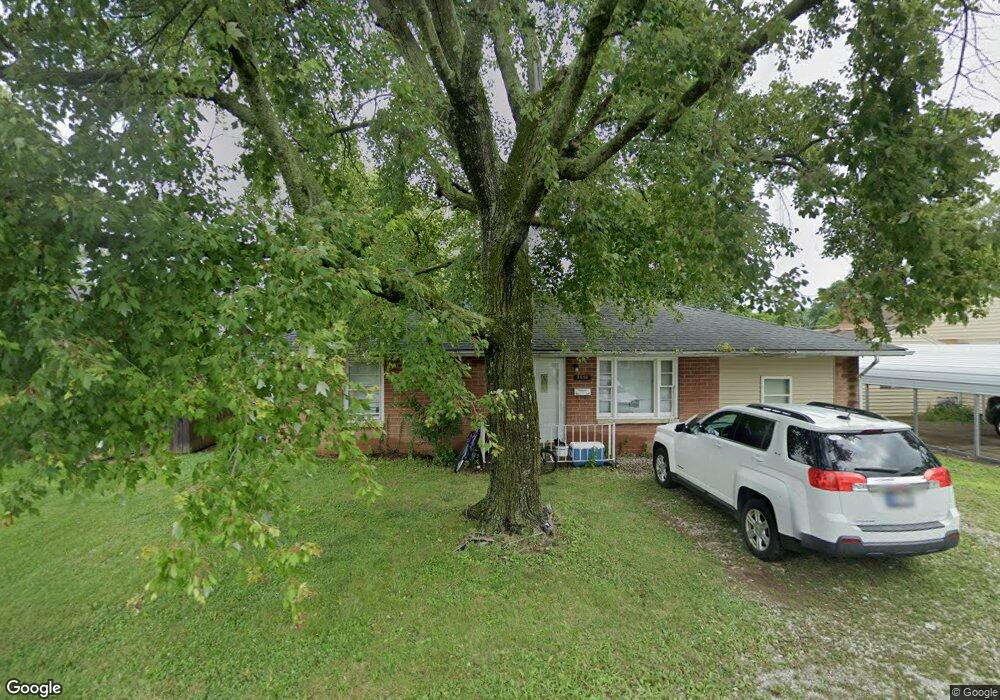
2616 13th St Columbus, IN 47201
Estimated Value: $151,000 - $170,911
2
Beds
1
Bath
816
Sq Ft
$196/Sq Ft
Est. Value
About This Home
This home is located at 2616 13th St, Columbus, IN 47201 and is currently estimated at $160,228, approximately $196 per square foot. 2616 13th St is a home located in Bartholomew County with nearby schools including L.F. Smith Elementary School, Central Middle School, and Columbus East High School.
Ownership History
Date
Name
Owned For
Owner Type
Purchase Details
Closed on
Feb 15, 2016
Sold by
Narsinghani Prem G and Narsinghani Duru P
Bought by
Narsinghani Prem G and Narsinghan Duru P
Current Estimated Value
Purchase Details
Closed on
Jul 14, 2006
Sold by
Watkins Bobby J
Bought by
Narsinghani Prem G and Narsinghani Duru P
Purchase Details
Closed on
Aug 21, 2002
Sold by
Witkowski Thomas J and Witkowski Janice M
Bought by
Watkins Bobby J
Purchase Details
Closed on
May 21, 2001
Sold by
Keaton Lennis C
Bought by
Witkowski Thomas J and Witkowski Janice M
Create a Home Valuation Report for This Property
The Home Valuation Report is an in-depth analysis detailing your home's value as well as a comparison with similar homes in the area
Home Values in the Area
Average Home Value in this Area
Purchase History
| Date | Buyer | Sale Price | Title Company |
|---|---|---|---|
| Narsinghani Prem G | -- | None Available | |
| Narsinghani Prem G | -- | Attorney | |
| Watkins Bobby J | -- | -- | |
| Witkowski Thomas J | $72,850 | -- |
Source: Public Records
Tax History Compared to Growth
Tax History
| Year | Tax Paid | Tax Assessment Tax Assessment Total Assessment is a certain percentage of the fair market value that is determined by local assessors to be the total taxable value of land and additions on the property. | Land | Improvement |
|---|---|---|---|---|
| 2024 | $2,923 | $130,000 | $23,000 | $107,000 |
| 2023 | $3,118 | $137,300 | $27,000 | $110,300 |
| 2022 | $2,778 | $122,700 | $27,000 | $95,700 |
| 2021 | $2,617 | $114,500 | $16,000 | $98,500 |
| 2020 | $1,816 | $79,600 | $16,000 | $63,600 |
| 2019 | $1,543 | $72,300 | $16,000 | $56,300 |
| 2018 | $1,801 | $71,000 | $16,000 | $55,000 |
| 2017 | $1,541 | $70,700 | $15,300 | $55,400 |
| 2016 | $1,545 | $70,700 | $15,300 | $55,400 |
| 2014 | $1,555 | $69,900 | $15,300 | $54,600 |
Source: Public Records
Map
Nearby Homes