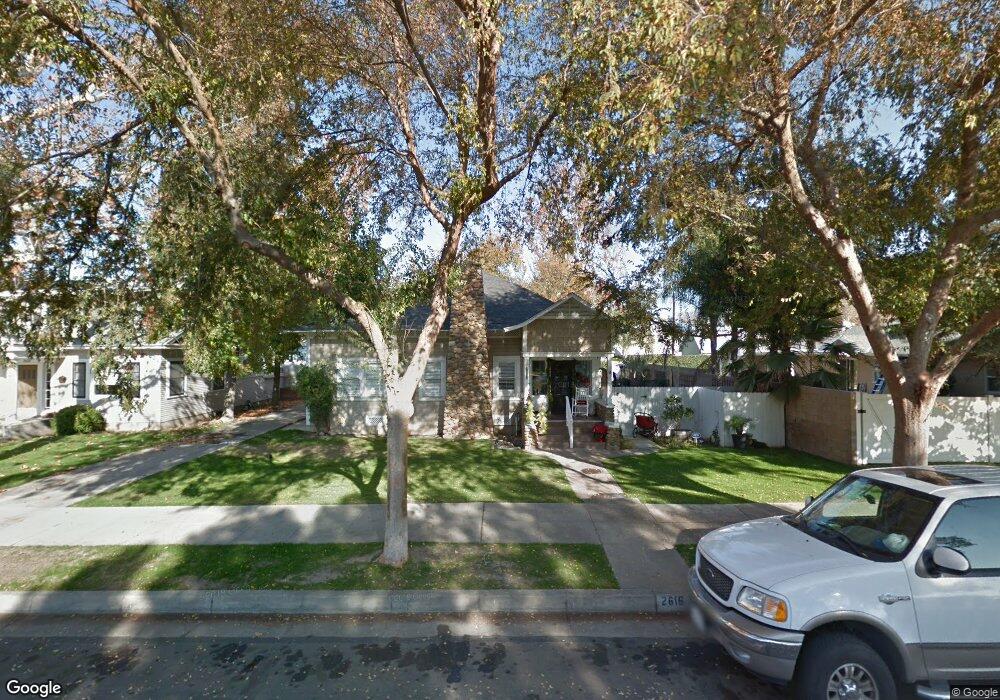
2616 20th St Bakersfield, CA 93301
Riviera/Westchester NeighborhoodEstimated Value: $390,000 - $453,000
3
Beds
1
Bath
1,418
Sq Ft
$289/Sq Ft
Est. Value
About This Home
This home is located at 2616 20th St, Bakersfield, CA 93301 and is currently estimated at $409,430, approximately $288 per square foot. 2616 20th St is a home located in Kern County with nearby schools including Franklin Elementary School, Emerson Middle School, and Bakersfield High School.
Ownership History
Date
Name
Owned For
Owner Type
Purchase Details
Closed on
May 20, 2003
Sold by
Peters Jim D and Peters Betty A
Bought by
Raytis Daniel N and Raytis Katy C
Current Estimated Value
Home Financials for this Owner
Home Financials are based on the most recent Mortgage that was taken out on this home.
Original Mortgage
$152,000
Outstanding Balance
$64,038
Interest Rate
5.37%
Mortgage Type
Purchase Money Mortgage
Estimated Equity
$345,392
Purchase Details
Closed on
Jan 15, 1999
Sold by
Peters Jim D and Peters Betty A
Bought by
Peters Jim D and Peters Betty A
Purchase Details
Closed on
Jul 31, 1998
Sold by
Mckeehan Will Davey and Mckeehan Susan Arlene
Bought by
Peters Jim D and Peters Betty A
Home Financials for this Owner
Home Financials are based on the most recent Mortgage that was taken out on this home.
Original Mortgage
$60,000
Interest Rate
6.88%
Create a Home Valuation Report for This Property
The Home Valuation Report is an in-depth analysis detailing your home's value as well as a comparison with similar homes in the area
Home Values in the Area
Average Home Value in this Area
Purchase History
| Date | Buyer | Sale Price | Title Company |
|---|---|---|---|
| Raytis Daniel N | $190,000 | Chicago Title | |
| Peters Jim D | -- | -- | |
| Peters Jim D | $80,000 | Chicago Title Insurance |
Source: Public Records
Mortgage History
| Date | Status | Borrower | Loan Amount |
|---|---|---|---|
| Open | Raytis Daniel N | $152,000 | |
| Previous Owner | Peters Jim D | $60,000 | |
| Closed | Raytis Daniel N | $38,000 |
Source: Public Records
Tax History Compared to Growth
Tax History
| Year | Tax Paid | Tax Assessment Tax Assessment Total Assessment is a certain percentage of the fair market value that is determined by local assessors to be the total taxable value of land and additions on the property. | Land | Improvement |
|---|---|---|---|---|
| 2025 | $4,191 | $301,939 | $72,401 | $229,538 |
| 2024 | $4,191 | $296,020 | $70,982 | $225,038 |
| 2023 | $4,107 | $290,218 | $69,591 | $220,627 |
| 2022 | $4,023 | $284,529 | $68,227 | $216,302 |
| 2021 | $3,898 | $278,952 | $66,890 | $212,062 |
| 2020 | $3,859 | $276,094 | $66,205 | $209,889 |
| 2019 | $3,782 | $276,094 | $66,205 | $209,889 |
| 2018 | $3,693 | $265,376 | $63,635 | $201,741 |
| 2017 | $3,675 | $260,174 | $62,388 | $197,786 |
| 2016 | $2,609 | $189,000 | $47,000 | $142,000 |
| 2015 | $2,571 | $184,000 | $46,000 | $138,000 |
| 2014 | $2,070 | $143,000 | $36,000 | $107,000 |
Source: Public Records
Map
Nearby Homes