2616 W Irisado Cir Mesa, AZ 85202
Dobson NeighborhoodEstimated Value: $410,198 - $533,000
--
Bed
2
Baths
1,961
Sq Ft
$250/Sq Ft
Est. Value
About This Home
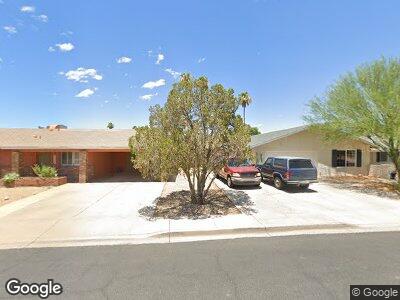
This home is located at 2616 W Irisado Cir, Mesa, AZ 85202 and is currently estimated at $490,050, approximately $249 per square foot. 2616 W Irisado Cir is a home located in Maricopa County with nearby schools including Franklin at Brimhall Elementary School, Washington Elementary School, and Franklin Accelerated Academy Jordan Campus.
Ownership History
Date
Name
Owned For
Owner Type
Purchase Details
Closed on
Aug 15, 2005
Sold by
Becker Jacob and Becker Beth Ann
Bought by
Becker Jacob and Becker Beth Ann
Current Estimated Value
Home Financials for this Owner
Home Financials are based on the most recent Mortgage that was taken out on this home.
Original Mortgage
$216,000
Outstanding Balance
$117,632
Interest Rate
5.56%
Mortgage Type
Fannie Mae Freddie Mac
Estimated Equity
$358,284
Purchase Details
Closed on
Jan 23, 2004
Sold by
Barkus Jay A and Barkus Julie A
Bought by
Becker Jacob and Becker Beth Ann
Home Financials for this Owner
Home Financials are based on the most recent Mortgage that was taken out on this home.
Original Mortgage
$150,575
Interest Rate
5.79%
Mortgage Type
New Conventional
Purchase Details
Closed on
Feb 3, 1995
Sold by
Brown Rick D and Brown Coleen S
Bought by
Barrus Jay A and Barrus Julie A
Create a Home Valuation Report for This Property
The Home Valuation Report is an in-depth analysis detailing your home's value as well as a comparison with similar homes in the area
Home Values in the Area
Average Home Value in this Area
Purchase History
| Date | Buyer | Sale Price | Title Company |
|---|---|---|---|
| Becker Jacob | -- | -- | |
| Becker Jacob | $158,500 | Chicago Title Insurance Co | |
| Barrus Jay A | $103,000 | Lawyers Title |
Source: Public Records
Mortgage History
| Date | Status | Borrower | Loan Amount |
|---|---|---|---|
| Open | Becker Jacob | $216,000 | |
| Closed | Becker Jacob | $25,000 | |
| Closed | Becker Jacob | $12,000 | |
| Closed | Becker Jacob | $150,575 |
Source: Public Records
Tax History Compared to Growth
Tax History
| Year | Tax Paid | Tax Assessment Tax Assessment Total Assessment is a certain percentage of the fair market value that is determined by local assessors to be the total taxable value of land and additions on the property. | Land | Improvement |
|---|---|---|---|---|
| 2025 | $1,564 | $18,852 | -- | -- |
| 2024 | $1,583 | $17,954 | -- | -- |
| 2023 | $1,583 | $37,580 | $7,510 | $30,070 |
| 2022 | $1,548 | $27,750 | $5,550 | $22,200 |
| 2021 | $1,590 | $25,810 | $5,160 | $20,650 |
| 2020 | $1,569 | $24,000 | $4,800 | $19,200 |
| 2019 | $1,454 | $21,570 | $4,310 | $17,260 |
| 2018 | $1,388 | $19,800 | $3,960 | $15,840 |
| 2017 | $1,344 | $18,510 | $3,700 | $14,810 |
| 2016 | $1,320 | $18,060 | $3,610 | $14,450 |
| 2015 | $1,246 | $16,320 | $3,260 | $13,060 |
Source: Public Records
Map
Nearby Homes
- 1857 S El Marino Cir
- 2338 W Lindner Ave Unit 48
- 2338 W Lindner Ave Unit 22
- 2331 W Via Rialto Cir
- 2324 W Via Rialto Cir
- 2524 W Kiva Ave
- 2029 S Las Palmas
- 2337 E Riviera Dr
- 2325 E Hermosa Dr
- 2256 W Lindner Ave Unit 25
- 2138 E Minton Dr
- 2430 E Hermosa Dr
- 2130 E Dunbar Dr
- 2146 E Donner Dr
- 2114 S El Marino
- 2112 E Minton Dr
- 2142 E Donner Dr
- 2145 E Donner Dr
- 2125 E Dunbar Dr
- 2123 E Ellis Dr
- 2616 W Irisado Cir
- 2620 W Irisado Cir
- 2608 W Irisado Cir
- 2615 W Isabella Ave
- 2613 W Isabella Ave
- 2624 W Irisado Cir
- 2617 W Irisado Cir
- 2619 W Isabella Ave
- 2613 W Irisado Cir
- 1744 S Don Luis Cir
- 2625 W Irisado Cir
- 2611 W Isabella Ave
- 1747 S Don Luis Cir
- 2636 W Javelina Ave
- 2636 W Javelina Ave
- 1736 S Don Luis Cir
- 2709 W Javelina Ave
- 2607 W Isabella Ave
- 2701 W Javelina Ave
- 2642 W Javelina Ave