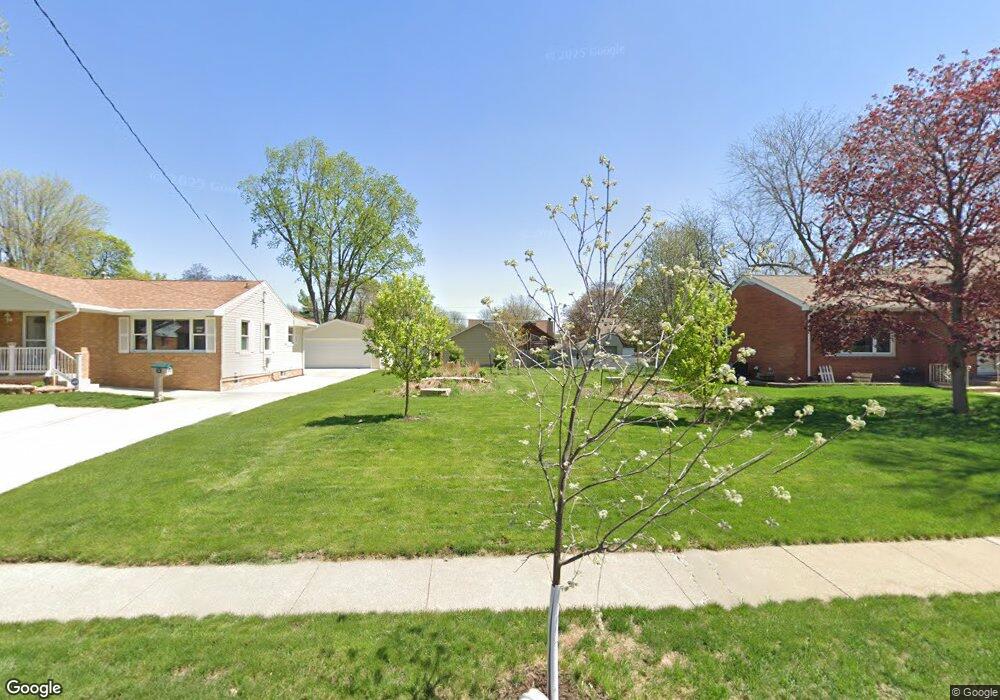
2617 48th Place Des Moines, IA 50310
Beaverdale NeighborhoodEstimated Value: $169,000 - $259,000
2
Beds
1
Bath
968
Sq Ft
$216/Sq Ft
Est. Value
About This Home
This home is located at 2617 48th Place, Des Moines, IA 50310 and is currently estimated at $208,676, approximately $215 per square foot. 2617 48th Place is a home located in Polk County with nearby schools including Hillis Elementary School, Meredith Middle School, and Hoover High School.
Ownership History
Date
Name
Owned For
Owner Type
Purchase Details
Closed on
Jul 30, 2018
Sold by
Snuffin Michael S and Snuffin Cara L
Bought by
City Of Des Moines
Current Estimated Value
Purchase Details
Closed on
Jan 9, 2006
Sold by
Snuffin Michael S and Snuffin Kara L
Bought by
Snuffin Michael S and Snuffin Cara L
Home Financials for this Owner
Home Financials are based on the most recent Mortgage that was taken out on this home.
Original Mortgage
$125,352
Interest Rate
6.42%
Mortgage Type
FHA
Purchase Details
Closed on
Apr 22, 1999
Sold by
Tyler Construction Services Inc
Bought by
Snuffin Michael S and Snuffin Kara L
Home Financials for this Owner
Home Financials are based on the most recent Mortgage that was taken out on this home.
Original Mortgage
$79,200
Interest Rate
7.17%
Purchase Details
Closed on
Nov 4, 1998
Sold by
Henchen Eileen E
Bought by
Tyler Construction Services Inc
Create a Home Valuation Report for This Property
The Home Valuation Report is an in-depth analysis detailing your home's value as well as a comparison with similar homes in the area
Home Values in the Area
Average Home Value in this Area
Purchase History
| Date | Buyer | Sale Price | Title Company |
|---|---|---|---|
| City Of Des Moines | $151,360 | None Available | |
| Snuffin Michael S | -- | Nebraska Title Rfg | |
| Snuffin Michael S | $87,500 | -- | |
| Tyler Construction Services Inc | $47,000 | -- |
Source: Public Records
Mortgage History
| Date | Status | Borrower | Loan Amount |
|---|---|---|---|
| Previous Owner | Snuffin Michael S | $125,352 | |
| Previous Owner | Snuffin Michael S | $79,200 |
Source: Public Records
Tax History Compared to Growth
Tax History
| Year | Tax Paid | Tax Assessment Tax Assessment Total Assessment is a certain percentage of the fair market value that is determined by local assessors to be the total taxable value of land and additions on the property. | Land | Improvement |
|---|---|---|---|---|
| 2025 | $4 | $200 | $200 | -- |
| 2024 | $4 | $200 | $200 | $0 |
| 2023 | $4 | $200 | $200 | $0 |
| 2022 | $4 | $200 | $200 | $0 |
| 2021 | $6 | $200 | $200 | $0 |
| 2020 | $3,340 | $200 | $200 | $0 |
| 2019 | $3,340 | $0 | $0 | $0 |
| 2018 | $3,340 | $137,600 | $28,800 | $108,800 |
| 2017 | $3,124 | $137,600 | $28,800 | $108,800 |
| 2016 | $3,038 | $127,300 | $26,300 | $101,000 |
| 2015 | $3,038 | $127,300 | $26,300 | $101,000 |
| 2014 | $3,130 | $129,800 | $26,400 | $103,400 |
Source: Public Records
Map
Nearby Homes