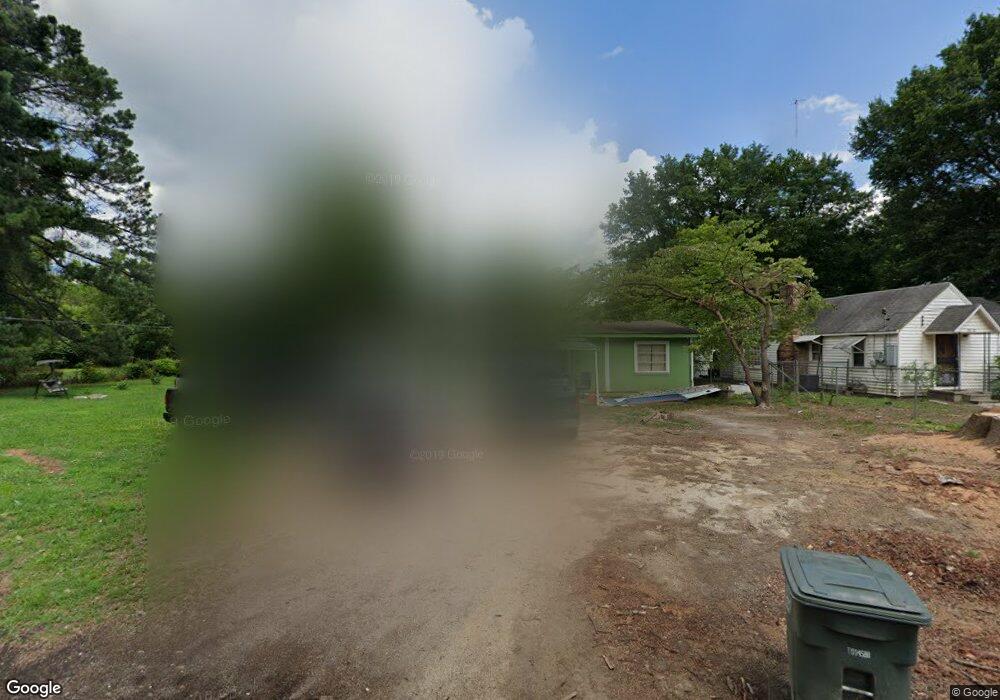
2618 Henderson St Memphis, TN 38127
Frayser NeighborhoodEstimated Value: $71,390 - $91,000
3
Beds
1
Bath
1,230
Sq Ft
$66/Sq Ft
Est. Value
About This Home
This home is located at 2618 Henderson St, Memphis, TN 38127 and is currently estimated at $80,598, approximately $65 per square foot. 2618 Henderson St is a home located in Shelby County with nearby schools including Whitney Achievement Elementary School, Grandview Heights Middle, and Trezevant High School.
Ownership History
Date
Name
Owned For
Owner Type
Purchase Details
Closed on
Mar 16, 2015
Sold by
Investments Inc
Bought by
Miranda Daniel and Terrazas Maria Del Carmen
Current Estimated Value
Purchase Details
Closed on
Jan 26, 2015
Sold by
Nordberg Howard
Bought by
Investments Inc
Purchase Details
Closed on
Jan 22, 2008
Sold by
Gonzalez David E
Bought by
Nordberg Howard
Purchase Details
Closed on
Oct 11, 2007
Sold by
Wells Fargo Bank Na
Bought by
Gonzalez David E
Purchase Details
Closed on
Nov 3, 2006
Sold by
Rice Alan
Bought by
Wells Fargo Bank Na
Purchase Details
Closed on
Feb 27, 2004
Sold by
Cockrell Jamie L Green
Bought by
Rice Alan
Home Financials for this Owner
Home Financials are based on the most recent Mortgage that was taken out on this home.
Original Mortgage
$44,200
Interest Rate
5.68%
Mortgage Type
Purchase Money Mortgage
Purchase Details
Closed on
Oct 16, 1995
Bought by
Atkins Louise G
Create a Home Valuation Report for This Property
The Home Valuation Report is an in-depth analysis detailing your home's value as well as a comparison with similar homes in the area
Home Values in the Area
Average Home Value in this Area
Purchase History
| Date | Buyer | Sale Price | Title Company |
|---|---|---|---|
| Miranda Daniel | $7,900 | None Available | |
| Investments Inc | $401 | None Available | |
| Nordberg Howard | $61,000 | None Available | |
| Gonzalez David E | $19,000 | Associates Closing & Title H | |
| Wells Fargo Bank Na | $36,000 | None Available | |
| Rice Alan | $52,000 | -- | |
| Atkins Louise G | $19,750 | -- |
Source: Public Records
Mortgage History
| Date | Status | Borrower | Loan Amount |
|---|---|---|---|
| Previous Owner | Rice Alan | $44,200 |
Source: Public Records
Tax History Compared to Growth
Tax History
| Year | Tax Paid | Tax Assessment Tax Assessment Total Assessment is a certain percentage of the fair market value that is determined by local assessors to be the total taxable value of land and additions on the property. | Land | Improvement |
|---|---|---|---|---|
| 2025 | $437 | $18,350 | $1,925 | $16,425 |
| 2024 | $437 | $12,900 | $1,700 | $11,200 |
| 2023 | $786 | $12,900 | $1,700 | $11,200 |
| 2022 | $786 | $12,900 | $1,700 | $11,200 |
| 2021 | $795 | $12,900 | $1,700 | $11,200 |
| 2020 | $609 | $8,400 | $1,700 | $6,700 |
| 2019 | $609 | $8,400 | $1,700 | $6,700 |
| 2018 | $609 | $8,400 | $1,700 | $6,700 |
| 2017 | $345 | $8,400 | $1,700 | $6,700 |
| 2016 | $364 | $8,325 | $0 | $0 |
| 2014 | $364 | $8,325 | $0 | $0 |
Source: Public Records
Map
Nearby Homes
- 1557 Ontario Ave
- 2558 Steele St
- 1571 Delano Ave
- 1560 Delano Ave
- 1601 Oberle Rd
- 1725 Ontario Ave
- 1724 Ontario Ave
- 1364 Vicoscia Ave
- 1797 Dupont Ave
- 1640 Portland Ave
- 1862 Dupont Ave
- 1577 Alta Vista Ave
- 2762 Overton Crossing St
- 2766 Overton Crossing St
- 1823 Cedarhurst Ave
- 1343 Dove St
- 1247 Vistaview Cove
- 1872 Portland Ave
- 1883 Cedarhurst Ave
- 2679 Woodlawn Terrace
- 2610 Henderson St
- 2630 Henderson St
- 2596 Henderson St
- 1533 Ontario Ave
- 2619 Henderson St
- 2611 Henderson St
- 2627 Henderson St
- 2603 Henderson St
- 1539 Ontario Ave
- 2601 N Watkins St
- 1530 Ontario Ave
- 2597 Henderson St
- 2582 Henderson St
- 1549 Ontario Ave
- 2589 Henderson St
- 1522 Dupont Ave
- 1571 Ontario Ave
- 2574 Henderson St
- 2583 Henderson St
- 1516 Dupont Ave