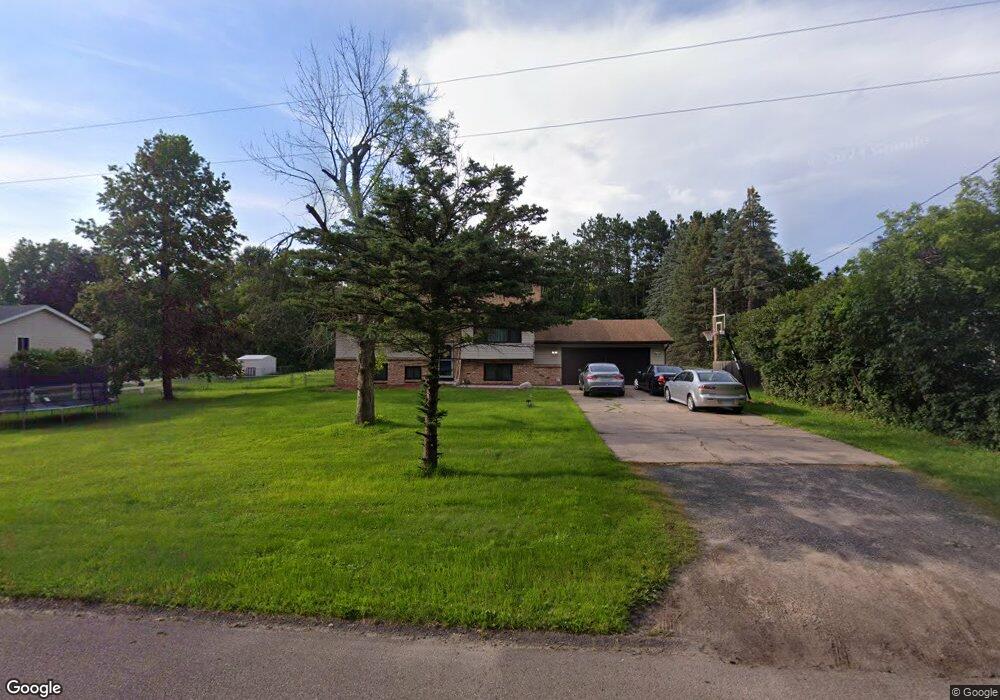
2619 171st Ln NE Andover, MN 55304
Estimated Value: $338,000 - $393,000
4
Beds
2
Baths
1,790
Sq Ft
$204/Sq Ft
Est. Value
About This Home
This home is located at 2619 171st Ln NE, Andover, MN 55304 and is currently estimated at $365,018, approximately $203 per square foot. 2619 171st Ln NE is a home located in Anoka County with nearby schools including McKinley Elementary School, Roosevelt Middle School, and Blaine Senior High School.
Ownership History
Date
Name
Owned For
Owner Type
Purchase Details
Closed on
Jun 21, 2021
Sold by
Kinzer Cheri L
Bought by
Zeon Glaigborgar Philip and Zeon Famatta
Current Estimated Value
Home Financials for this Owner
Home Financials are based on the most recent Mortgage that was taken out on this home.
Original Mortgage
$301,439
Outstanding Balance
$272,915
Interest Rate
2.9%
Mortgage Type
FHA
Estimated Equity
$92,103
Purchase Details
Closed on
Jun 25, 2009
Sold by
Peterson Todd A and Peterson Heather J
Bought by
Kinzer Jonathan P and Kinzer Cheri L
Home Financials for this Owner
Home Financials are based on the most recent Mortgage that was taken out on this home.
Original Mortgage
$151,490
Interest Rate
4.94%
Mortgage Type
New Conventional
Purchase Details
Closed on
Dec 30, 1997
Sold by
Stairs Scott M and Fischer Stairs Joanne T
Bought by
Peterson Todd A and Peterson Heather J
Create a Home Valuation Report for This Property
The Home Valuation Report is an in-depth analysis detailing your home's value as well as a comparison with similar homes in the area
Home Values in the Area
Average Home Value in this Area
Purchase History
| Date | Buyer | Sale Price | Title Company |
|---|---|---|---|
| Zeon Glaigborgar Philip | $307,000 | Watermark Title Agency | |
| Kinzer Jonathan P | $152,000 | -- | |
| Peterson Todd A | $105,000 | -- |
Source: Public Records
Mortgage History
| Date | Status | Borrower | Loan Amount |
|---|---|---|---|
| Open | Zeon Glaigborgar Philip | $301,439 | |
| Previous Owner | Kinzer Jonathan P | $151,490 |
Source: Public Records
Tax History Compared to Growth
Tax History
| Year | Tax Paid | Tax Assessment Tax Assessment Total Assessment is a certain percentage of the fair market value that is determined by local assessors to be the total taxable value of land and additions on the property. | Land | Improvement |
|---|---|---|---|---|
| 2025 | $2,429 | $317,000 | $104,400 | $212,600 |
| 2024 | $2,429 | $290,900 | $87,400 | $203,500 |
| 2023 | $2,405 | $302,700 | $87,400 | $215,300 |
| 2022 | $2,189 | $296,300 | $71,300 | $225,000 |
| 2021 | $2,027 | $241,100 | $62,400 | $178,700 |
| 2020 | $2,089 | $218,500 | $56,400 | $162,100 |
| 2019 | $2,012 | $216,900 | $52,200 | $164,700 |
| 2018 | $1,946 | $203,200 | $0 | $0 |
| 2017 | $1,745 | $190,100 | $0 | $0 |
| 2016 | $1,701 | $163,600 | $0 | $0 |
| 2015 | -- | $163,600 | $44,500 | $119,100 |
| 2014 | -- | $140,100 | $34,800 | $105,300 |
Source: Public Records
Map
Nearby Homes
- 17855 Urbank St NE
- 2728 174th Ave NE
- 2304 169th Ave NE
- XXX Staples St NE
- 2349 175th Ln NE
- 825 174th Ave NE
- 16957 E Lake Netta Dr NE
- XXX 166th Ln NE
- 2020 Crosstown Blvd NE
- 3309 171st Ave NE
- 1960 Mankato Cir NE
- 17742 Oakland Dr NE
- 17509 London St NE
- 17984 Taconite St NE
- 2475 179th Ave NE
- 2336 Swedish Dr NE
- 2374 Swedish Dr NE
- TBD S 179th Ave NE
- xxx 179th Ln NE
- 0000 Xylite St NE
- 2609 171st Ln NE
- 2633 171st Ln NE
- 2638 171st Ln NE
- 17167 Xylite St NE
- 2649 171st Ln NE
- 17115 Xylite St NE
- 17154 Xylite St NE
- 17122 Xylite St NE
- 17160 Xylite St NE
- 17217 Xylite St NE
- 2665 171st Ln NE
- 17065 Xylite St NE
- 2658 171st Ln NE
- 17164 Xylite St NE
- 2715 171st Ln NE
- 2708 171st Ln NE
- 17224 Xylite St NE
- 17208 Zumbrota St NE
- 17228 Zumbrota St NE
- 2722 171st Ln NE