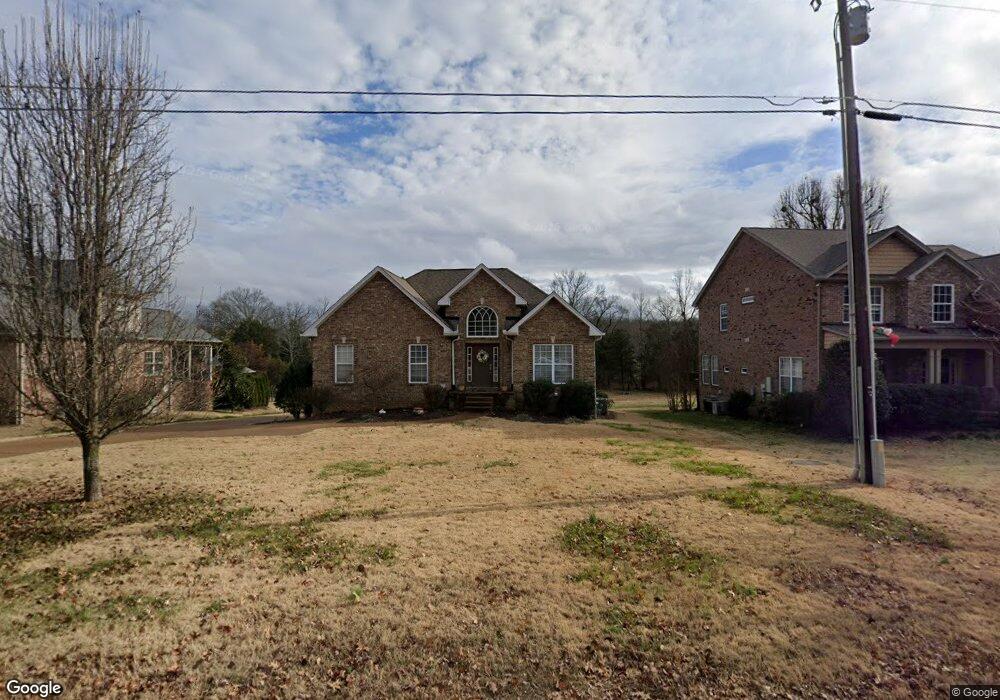
262 Quad Oak Dr Mount Juliet, TN 37122
Estimated Value: $431,000 - $544,000
3
Beds
3
Baths
2,414
Sq Ft
$195/Sq Ft
Est. Value
About This Home
This home is located at 262 Quad Oak Dr, Mount Juliet, TN 37122 and is currently estimated at $470,521, approximately $194 per square foot. 262 Quad Oak Dr is a home located in Wilson County with nearby schools including Gladeville Elementary School, Gladeville Middle School, and Wilson Central High School.
Ownership History
Date
Name
Owned For
Owner Type
Purchase Details
Closed on
Jun 7, 2021
Sold by
Jesa Llc
Bought by
Evolution Interactive Llc
Current Estimated Value
Purchase Details
Closed on
Jul 18, 2018
Sold by
Williams Phillip Brent
Bought by
Jesa Llc
Purchase Details
Closed on
Aug 20, 2015
Sold by
Williams Phillip B
Bought by
Williams Phillip Brent
Purchase Details
Closed on
Aug 14, 2008
Sold by
H Grp Llc
Bought by
Williams Phillip B
Home Financials for this Owner
Home Financials are based on the most recent Mortgage that was taken out on this home.
Original Mortgage
$177,148
Interest Rate
6.21%
Purchase Details
Closed on
Sep 19, 2006
Bought by
Hermitage Developers Inc
Purchase Details
Closed on
Oct 8, 2002
Bought by
Hodges Alfred L and Hodges Pamela S
Purchase Details
Closed on
Jun 19, 1998
Bought by
Mires Monty
Create a Home Valuation Report for This Property
The Home Valuation Report is an in-depth analysis detailing your home's value as well as a comparison with similar homes in the area
Home Values in the Area
Average Home Value in this Area
Purchase History
| Date | Buyer | Sale Price | Title Company |
|---|---|---|---|
| Evolution Interactive Llc | $290,000 | Stewart Title Company Tn | |
| Jesa Llc | $268,000 | Birthright Title Llc | |
| Williams Phillip Brent | -- | -- | |
| Williams Phillip Brent | -- | -- | |
| Williams Phillip B | $233,841 | -- | |
| Hermitage Developers Inc | $392,000 | -- | |
| Hodges Alfred L | $257,700 | -- | |
| Mires Monty | $159,700 | -- |
Source: Public Records
Mortgage History
| Date | Status | Borrower | Loan Amount |
|---|---|---|---|
| Previous Owner | Mires Monty | $177,148 | |
| Previous Owner | Mires Monty | $45,000 |
Source: Public Records
Tax History Compared to Growth
Tax History
| Year | Tax Paid | Tax Assessment Tax Assessment Total Assessment is a certain percentage of the fair market value that is determined by local assessors to be the total taxable value of land and additions on the property. | Land | Improvement |
|---|---|---|---|---|
| 2024 | $1,589 | $83,250 | $25,000 | $58,250 |
| 2022 | $1,589 | $83,250 | $25,000 | $58,250 |
| 2021 | $1,589 | $83,250 | $25,000 | $58,250 |
| 2020 | $1,608 | $83,250 | $25,000 | $58,250 |
| 2019 | $1,600 | $63,525 | $13,750 | $49,775 |
| 2018 | $1,600 | $63,525 | $13,750 | $49,775 |
| 2017 | $1,600 | $63,525 | $13,750 | $49,775 |
| 2016 | $1,600 | $63,525 | $13,750 | $49,775 |
| 2015 | $1,633 | $63,525 | $13,750 | $49,775 |
| 2014 | $1,389 | $54,024 | $0 | $0 |
Source: Public Records
Map
Nearby Homes
- 237 Quad Oak Dr
- 0 Lohman Rd
- 800 Evan Ct
- 603 Sophia Ct
- 522 Acorn Way
- 2115 Harkreader Rd
- 20 Friary Ct
- 1964 Harkreader Rd
- 1013 Station Cir
- 665 Castle Rd
- 580 Windy Rd
- 532 Windy Rd
- 1316 Beasley Blvd
- 1318 Beasley Blvd
- 1320 Beasley Blvd
- 1322 Beasley Blvd
- 1317 Beasley Blvd
- 412 Butler Rd
- 1319 Beasley Blvd
- 1324 Beasley Blvd
- 260 Quad Oak Dr
- 264 Quad Oak Dr
- 266 Quad Oak Dr
- 258 Quad Oak Dr
- 257 Quad Oak Dr
- 268 Quad Oak Dr
- 269 Quad Oak Dr
- 270 Quad Oak Dr
- 255 Quad Oak Dr
- 271 Quad Oak Dr
- 272 Quad Oak Dr
- 273 Quad Oak Dr
- 251 Quad Oak Dr
- 274 Quad Oak Dr
- 275 Quad Oak Dr
- 252 Quad Oak Dr
- 276 Quad Oak Dr
- 277 Quad Oak Dr
- 1105 Tanya Ct
- 250 Quad Oak Dr