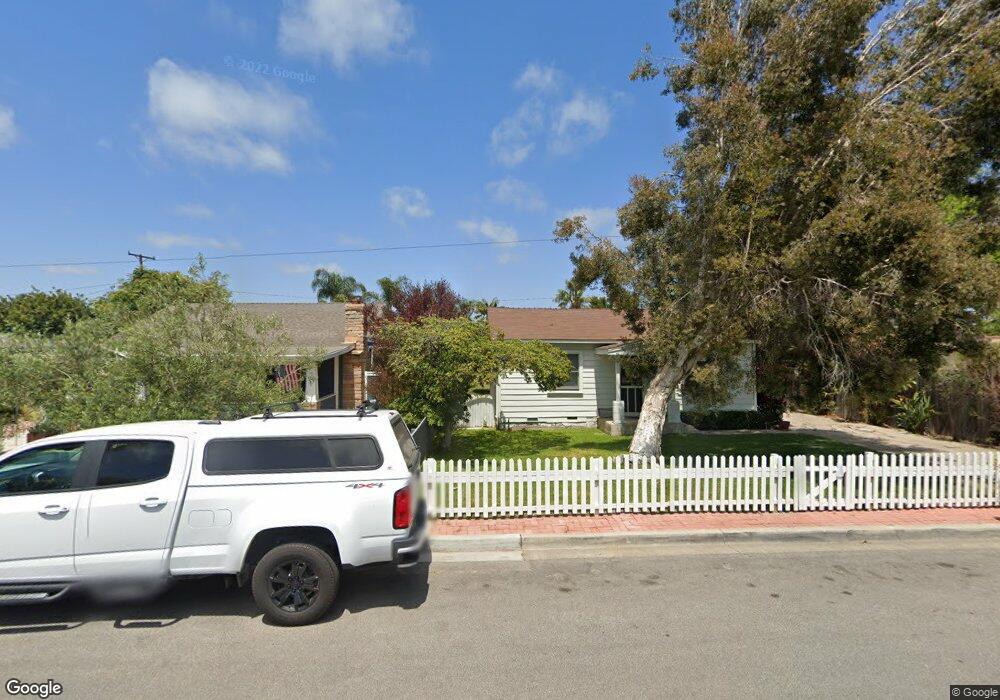
262 Walnut St Costa Mesa, CA 92627
Downtown Costa Mesa NeighborhoodEstimated Value: $1,582,000 - $2,360,000
3
Beds
2
Baths
1,903
Sq Ft
$1,100/Sq Ft
Est. Value
About This Home
This home is located at 262 Walnut St, Costa Mesa, CA 92627 and is currently estimated at $2,093,292, approximately $1,099 per square foot. 262 Walnut St is a home located in Orange County with nearby schools including Heinz Kaiser Elementary School, Woodland Elementary School, and Horace Ensign Intermediate School.
Ownership History
Date
Name
Owned For
Owner Type
Purchase Details
Closed on
Oct 3, 2003
Sold by
Oleary Brian David
Bought by
Oleary Brian David and Trust Of Brian David Oleary
Current Estimated Value
Purchase Details
Closed on
Mar 27, 2003
Sold by
Eder Laura
Bought by
Oleary Brian David
Home Financials for this Owner
Home Financials are based on the most recent Mortgage that was taken out on this home.
Original Mortgage
$452,000
Interest Rate
5%
Mortgage Type
Purchase Money Mortgage
Purchase Details
Closed on
Feb 28, 2003
Sold by
Clayton Matt and Clayton Julie
Bought by
Oleary Brian David
Home Financials for this Owner
Home Financials are based on the most recent Mortgage that was taken out on this home.
Original Mortgage
$452,000
Interest Rate
5%
Mortgage Type
Purchase Money Mortgage
Purchase Details
Closed on
Sep 17, 1998
Sold by
Hoffman John P
Bought by
Clayton Matt and Clayton Julie
Home Financials for this Owner
Home Financials are based on the most recent Mortgage that was taken out on this home.
Original Mortgage
$244,168
Interest Rate
7.42%
Purchase Details
Closed on
May 27, 1998
Sold by
Halliday Caroline M and Halliday Caroline M
Bought by
Hoffman John P
Purchase Details
Closed on
Mar 24, 1994
Sold by
Halliday Neil W and Halliday Caroline M
Bought by
Halliday Neil W and Halliday Caroline M
Purchase Details
Closed on
Mar 10, 1994
Sold by
Halliday Neil W
Bought by
Mid Exchange Inc
Purchase Details
Closed on
Dec 23, 1993
Sold by
Hoffman John P
Bought by
Hoffman John P and Halliday Neil W
Home Financials for this Owner
Home Financials are based on the most recent Mortgage that was taken out on this home.
Original Mortgage
$90,000
Interest Rate
7.38%
Create a Home Valuation Report for This Property
The Home Valuation Report is an in-depth analysis detailing your home's value as well as a comparison with similar homes in the area
Home Values in the Area
Average Home Value in this Area
Purchase History
| Date | Buyer | Sale Price | Title Company |
|---|---|---|---|
| Oleary Brian David | -- | -- | |
| Oleary Brian David | -- | Southland Title Corporation | |
| Oleary Brian David | $565,000 | Southland Title Corporation | |
| Clayton Matt | $272,000 | Orange Coast Title | |
| Hoffman John P | $51,000 | -- | |
| Halliday Neil W | -- | First American Title Ins Co | |
| Mid Exchange Inc | -- | First American Title Ins Co | |
| Halliday Caroline M | -- | First American Title Ins Co | |
| Hoffman John P | -- | Stewart Title |
Source: Public Records
Mortgage History
| Date | Status | Borrower | Loan Amount |
|---|---|---|---|
| Previous Owner | Oleary Brian David | $452,000 | |
| Previous Owner | Clayton Matt | $244,168 | |
| Previous Owner | Hoffman John P | $90,000 |
Source: Public Records
Tax History
| Year | Tax Paid | Tax Assessment Tax Assessment Total Assessment is a certain percentage of the fair market value that is determined by local assessors to be the total taxable value of land and additions on the property. | Land | Improvement |
|---|---|---|---|---|
| 2025 | $10,769 | $908,005 | $761,490 | $146,515 |
| 2024 | $10,769 | $890,201 | $746,558 | $143,643 |
| 2023 | $10,419 | $872,747 | $731,920 | $140,827 |
| 2022 | $10,117 | $855,635 | $717,569 | $138,066 |
| 2021 | $9,813 | $838,858 | $703,499 | $135,359 |
| 2020 | $9,691 | $830,257 | $696,285 | $133,972 |
| 2019 | $9,476 | $813,978 | $682,632 | $131,346 |
| 2018 | $9,282 | $798,018 | $669,247 | $128,771 |
| 2017 | $9,129 | $782,371 | $656,124 | $126,247 |
| 2016 | $8,936 | $767,031 | $643,259 | $123,772 |
| 2015 | $8,853 | $755,510 | $633,597 | $121,913 |
| 2014 | $8,656 | $740,711 | $621,186 | $119,525 |
Source: Public Records
Map
Nearby Homes
- 1938 Westminster Ave
- 212 E 19th St
- 1956 Rosemary Place
- 2019 Orange Ave
- 379 Walnut St
- 1935 Tustin Ave
- 308 E 18th St
- 2048 Garden Ln
- 201 E 21st St
- 2060 Newport Blvd
- 162 Rochester St
- 401 Bernard St Unit 211
- 401 Bernard St Unit 202
- 224 Pauline Place
- 184 E 21st St
- 329 Ford Rd
- 1973 Newport Blvd Unit 3
- 1973 Newport Blvd Unit 10
- 425 Ford Rd
- 2038 Aliso Ave
Your Personal Tour Guide
Ask me questions while you tour the home.