2620 Myrtle St Live Oak, CA 95953
Estimated Value: $275,000 - $304,000
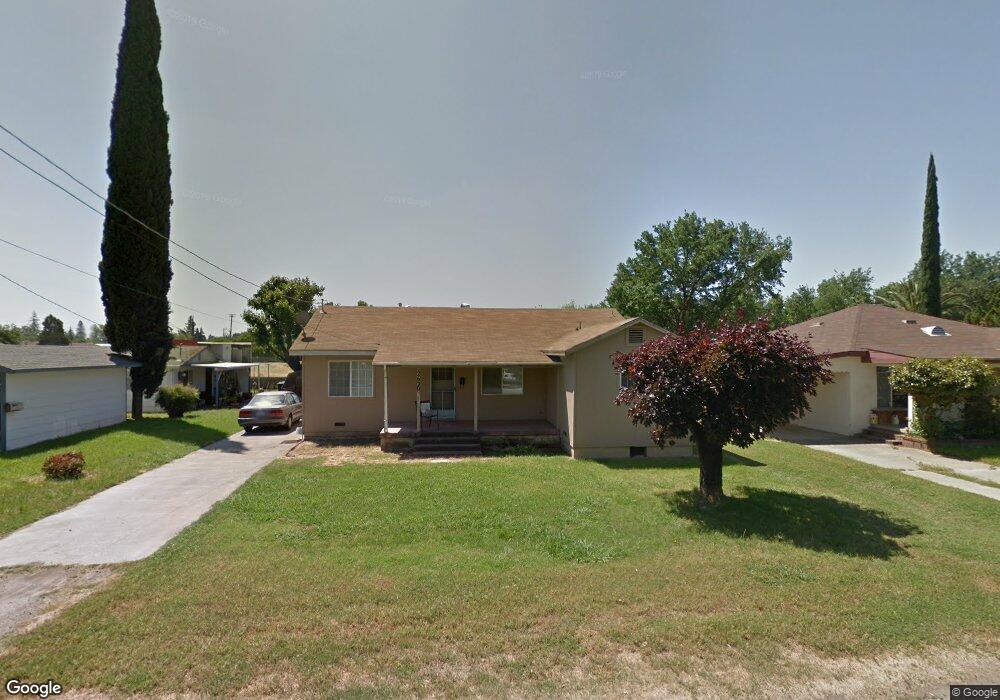
About This Home
This home is located at 2620 Myrtle St, Live Oak, CA 95953 and is currently estimated at $290,918, approximately $254 per square foot. 2620 Myrtle St is a home located in Sutter County.
Ownership History
We collect this data history from publicly available records. To have your information removed, we recommend requesting removal directly through your county’s website.
Purchase Details
Purchase History
We collect this data history from publicly available records. To have your information removed, we recommend requesting removal directly through your county’s website.
| Date | Buyer | Sale Price | Title Company |
|---|---|---|---|
| -- | None Available |
Tax History
We collect this data history from publicly available records. To have your information removed, we recommend requesting removal directly through your county’s website.
| Year | Tax Paid | Tax Assessment Tax Assessment Total Assessment is a certain percentage of the fair market value that is determined by local assessors to be the total taxable value of land and additions on the property. | Land | Improvement |
|---|---|---|---|---|
| 2025 | $798 | $63,842 | $31,921 | $31,921 |
| 2024 | $798 | $62,592 | $31,296 | $31,296 |
| 2023 | $798 | $61,366 | $30,683 | $30,683 |
| 2022 | $773 | $60,164 | $30,082 | $30,082 |
| 2021 | $693 | $59,008 | $29,504 | $29,504 |
| 2020 | $759 | $58,402 | $29,201 | $29,201 |
| 2019 | $740 | $57,258 | $28,629 | $28,629 |
| 2018 | $729 | $56,134 | $28,067 | $28,067 |
| 2017 | $722 | $55,034 | $27,517 | $27,517 |
| 2016 | $674 | $53,954 | $26,977 | $26,977 |
| 2015 | $668 | $53,144 | $26,572 | $26,572 |
| 2014 | $662 | $52,104 | $26,052 | $26,052 |
Map
- 2619 Myrtle St
- 10375 Live Oak Blvd
- 2455 Kola Ct
- 2915 Kola St
- 10383 Larkin Rd Unit 44
- 10383 Larkin Rd Unit 43
- 2537 Ivy St
- 10702 Stephanie Dr
- 10726 Irene Way
- 2891 Fir St
- 3182 Violet Ct
- 3206 Kola St
- 2624 Elm St
- 10863 California 99
- 2473 Date St
- 10118 Luther Rd
- 9612 Q St
- 2716 Peach St
- 9455 Albert St
- 9650 Poplar Way
- 2629 Myrtle St
- 2607 Myrtle St
- 2620 Nevada St
- 2639 Myrtle St
- 2632 Nevada St
- 2608 Nevada St
- 2649 Myrtle St
- 2630 Myrtle St
- 2646 Nevada St
- 2608 Myrtle St
- 2640 Myrtle St
- 10346 Live Oak Blvd
- 2596 Myrtle St
- 2659 Myrtle St
- 2650 Myrtle St
- 10302 Live Oak Blvd
- 2658 Nevada St
- 2661 Nevada St
- 10292 Live Oak Blvd
- 2679 Myrtle St
Ask me questions while you tour the home.