2620 Spinnaker Dr Aurora, IL 60503
Far Southeast NeighborhoodEstimated Value: $397,721 - $496,000
--
Bed
1
Bath
3,736
Sq Ft
$123/Sq Ft
Est. Value
About This Home
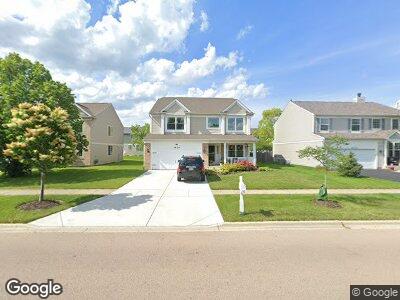
This home is located at 2620 Spinnaker Dr, Aurora, IL 60503 and is currently estimated at $459,180, approximately $122 per square foot. 2620 Spinnaker Dr is a home located in Will County with nearby schools including Homestead Elementary School, Murphy Junior High School, and Oswego East High School.
Ownership History
Date
Name
Owned For
Owner Type
Purchase Details
Closed on
Feb 27, 2019
Sold by
Pothula Vijay V and Dhanireddy Pradeepa
Bought by
Pothula Vijay V and Perumareddy Hima
Current Estimated Value
Home Financials for this Owner
Home Financials are based on the most recent Mortgage that was taken out on this home.
Original Mortgage
$125,000
Outstanding Balance
$83,627
Interest Rate
4.25%
Mortgage Type
New Conventional
Estimated Equity
$375,553
Purchase Details
Closed on
May 1, 2002
Sold by
Columbia Station Llc
Bought by
Pothula Vijay V and Chanireddy Pradeepa
Home Financials for this Owner
Home Financials are based on the most recent Mortgage that was taken out on this home.
Original Mortgage
$20,000
Interest Rate
4.75%
Mortgage Type
Credit Line Revolving
Create a Home Valuation Report for This Property
The Home Valuation Report is an in-depth analysis detailing your home's value as well as a comparison with similar homes in the area
Home Values in the Area
Average Home Value in this Area
Purchase History
| Date | Buyer | Sale Price | Title Company |
|---|---|---|---|
| Pothula Vijay V | -- | Attorney | |
| Pothula Vijay V | $263,000 | Ticor Title Insurance Compan |
Source: Public Records
Mortgage History
| Date | Status | Borrower | Loan Amount |
|---|---|---|---|
| Open | Peruma Pothula Vijay | $125,000 | |
| Closed | Pothula Vijay V | $175,000 | |
| Closed | Pothula Vijay V | $177,500 | |
| Closed | Pothula Vijay V | $14,900 | |
| Closed | Pothula Vijay V | $184,500 | |
| Closed | Pothula Vijay V | $190,000 | |
| Closed | Pothula Vijay V | $195,000 | |
| Closed | Pothula Vijay V | $200,000 | |
| Closed | Pothula Vijay V | $212,800 | |
| Previous Owner | Pothula Vijay V | $20,000 | |
| Previous Owner | Fothula Vijay V | $210,000 |
Source: Public Records
Tax History Compared to Growth
Tax History
| Year | Tax Paid | Tax Assessment Tax Assessment Total Assessment is a certain percentage of the fair market value that is determined by local assessors to be the total taxable value of land and additions on the property. | Land | Improvement |
|---|---|---|---|---|
| 2023 | $10,834 | $116,870 | $20,547 | $96,323 |
| 2022 | $10,378 | $107,609 | $19,437 | $88,172 |
| 2021 | $10,050 | $102,484 | $18,511 | $83,973 |
| 2020 | $9,622 | $100,860 | $18,218 | $82,642 |
| 2019 | $9,724 | $98,018 | $17,705 | $80,313 |
| 2018 | $9,126 | $89,417 | $17,315 | $72,102 |
| 2017 | $8,975 | $87,109 | $16,868 | $70,241 |
| 2016 | $8,996 | $85,234 | $16,505 | $68,729 |
| 2015 | $8,883 | $81,956 | $15,870 | $66,086 |
| 2014 | $8,883 | $73,700 | $15,870 | $57,830 |
| 2013 | $8,883 | $73,700 | $15,870 | $57,830 |
Source: Public Records
Map
Nearby Homes
- 2675 Dorothy Dr
- 2665 Tiffany St
- 2520 Dorothy Dr
- 2690 Moss Ln
- 2525 Ridge Rd Unit 6
- 2136 Colonial St Unit 1
- 2355 Avalon Ct
- 2410 Oakfield Ct
- 3025 Diane Dr
- 2645 Lindrick Ln
- 2495 Hafenrichter Rd
- 2630 Lindrick Ln
- 3147 Cambria Ct Unit 474
- 2270 Twilight Dr Unit 2270
- 2278 Twilight Dr
- 1704 Middlebury Dr Unit 302
- 1420 Bar Harbour Rd
- 1323 Middlebury Dr
- 1932 Royal Ln
- 2747 Hillsboro Blvd Unit 3
- 2620 Spinnaker Dr
- 2610 Spinnaker Dr
- 2630 Spinnaker Dr
- 2621 Rosehall Ln
- 2600 Spinnaker Dr
- 2611 Rosehall Ln
- 2631 Rosehall Ln Unit 1
- 2640 Spinnaker Dr
- 2601 Rosehall Ln Unit 1
- 2641 Rosehall Ln Unit 1
- 2590 Spinnaker Dr
- 1790 Woodbury Ln
- 1773 Brookfield Ct
- 2660 Spinnaker Dr
- 2661 Rosehall Ln
- 1784 Woodbury Ln
- 2585 Rosehall Ln Unit 1
- 2586 Rosehall Ln
- 1774 Brookfield Ct Unit 1
- 1765 Brookfield Ct