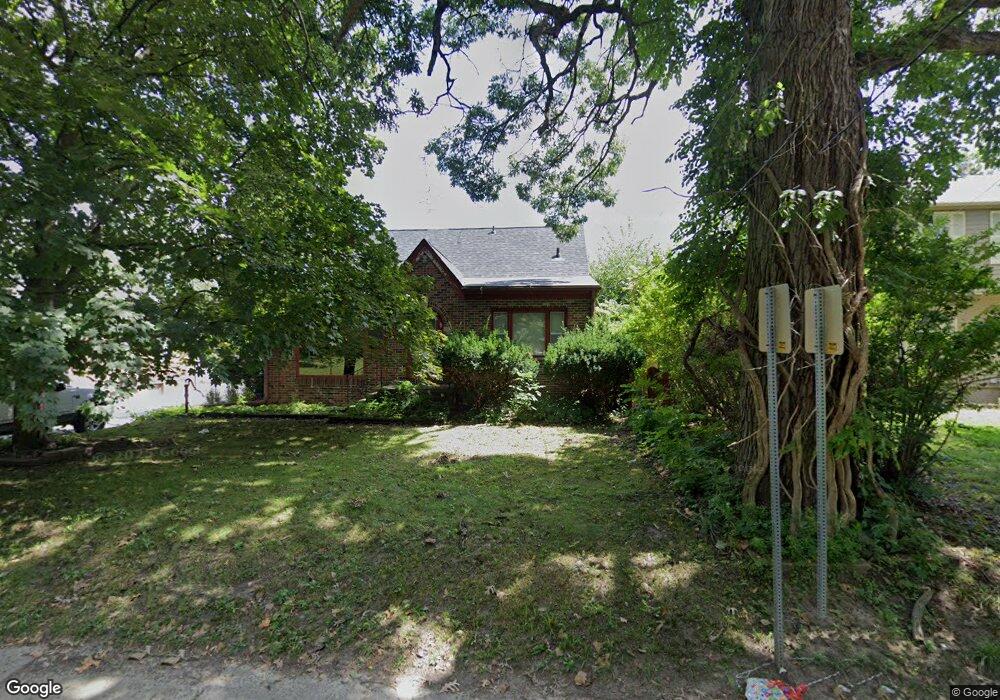
2621 30th St Des Moines, IA 50310
Doudna Heights-Glen Oaks NeighborhoodEstimated Value: $274,000 - $300,297
3
Beds
2
Baths
2,115
Sq Ft
$135/Sq Ft
Est. Value
About This Home
This home is located at 2621 30th St, Des Moines, IA 50310 and is currently estimated at $286,574, approximately $135 per square foot. 2621 30th St is a home located in Polk County with nearby schools including Monroe Elementary School, Meredith Middle School, and Hoover High School.
Ownership History
Date
Name
Owned For
Owner Type
Purchase Details
Closed on
Jun 11, 2012
Sold by
Chamberlin David E
Bought by
Daniels Don E
Current Estimated Value
Purchase Details
Closed on
Mar 31, 1987
Sold by
Hatch Gladys A
Bought by
Chamberlin David E and Daniels Don E
Home Financials for this Owner
Home Financials are based on the most recent Mortgage that was taken out on this home.
Original Mortgage
$50,000
Interest Rate
7.86%
Create a Home Valuation Report for This Property
The Home Valuation Report is an in-depth analysis detailing your home's value as well as a comparison with similar homes in the area
Home Values in the Area
Average Home Value in this Area
Purchase History
| Date | Buyer | Sale Price | Title Company |
|---|---|---|---|
| Daniels Don E | -- | None Available | |
| Chamberlin David E | $47,000 | -- |
Source: Public Records
Mortgage History
| Date | Status | Borrower | Loan Amount |
|---|---|---|---|
| Previous Owner | Chamberlin David E | $50,000 |
Source: Public Records
Tax History Compared to Growth
Tax History
| Year | Tax Paid | Tax Assessment Tax Assessment Total Assessment is a certain percentage of the fair market value that is determined by local assessors to be the total taxable value of land and additions on the property. | Land | Improvement |
|---|---|---|---|---|
| 2025 | $5,242 | $290,900 | $35,200 | $255,700 |
| 2024 | $5,242 | $266,500 | $31,700 | $234,800 |
| 2023 | $5,046 | $266,500 | $31,700 | $234,800 |
| 2022 | $5,008 | $214,100 | $26,500 | $187,600 |
| 2021 | $4,724 | $214,100 | $26,500 | $187,600 |
| 2020 | $4,908 | $189,300 | $23,300 | $166,000 |
| 2019 | $4,424 | $189,300 | $23,300 | $166,000 |
| 2018 | $4,378 | $164,600 | $19,700 | $144,900 |
| 2017 | $3,930 | $164,600 | $19,700 | $144,900 |
| 2016 | $3,828 | $145,300 | $17,200 | $128,100 |
| 2015 | $3,828 | $145,300 | $17,200 | $128,100 |
| 2014 | $3,710 | $139,600 | $16,300 | $123,300 |
Source: Public Records
Map
Nearby Homes
- 2615 30th St
- 3112 Sheridan Ave
- 2823 Holcomb Ave
- 3109 Holcomb Ave
- 2730 Sheridan Ave
- 2513 33rd St
- 2701 27th St
- 2742 Hickman Rd
- 2620 Arnold Rd
- 3016 30th St
- 2804 Boston Ave
- 2207 33rd St
- 3501 Sheridan Ave
- 2523 Prospect Rd
- 3514 Urbandale Ave
- 3120 30th St
- 3111 Lincoln Ave
- 2310 35th St
- 2119 35th St
- 2516 Boston Ave