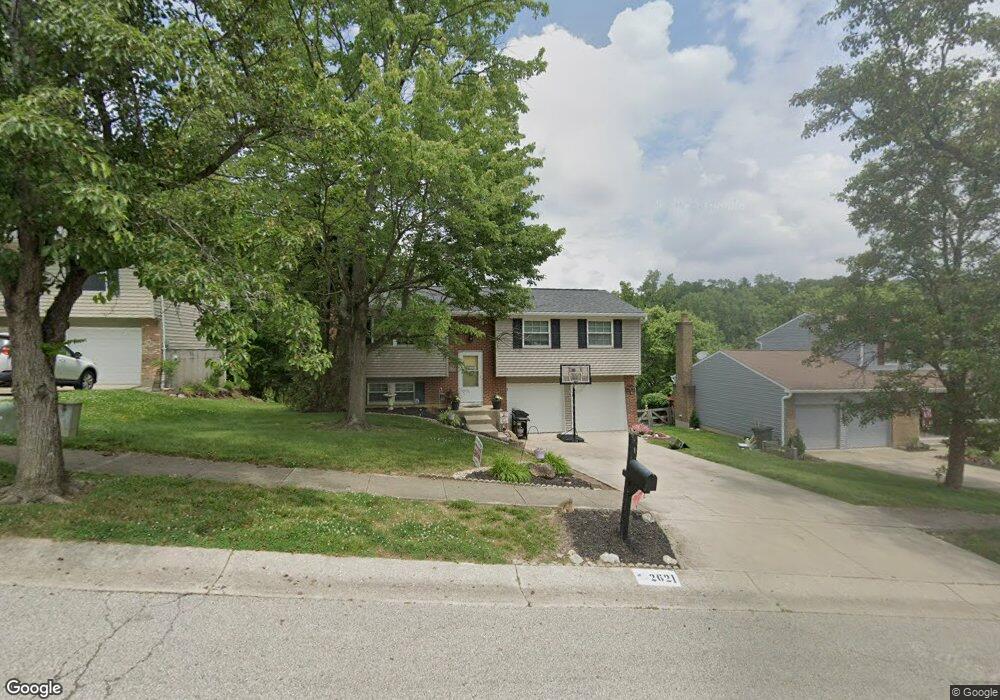
2621 Maple Tree Ct Cincinnati, OH 45236
Estimated Value: $265,000 - $301,000
3
Beds
2
Baths
1,568
Sq Ft
$182/Sq Ft
Est. Value
About This Home
This home is located at 2621 Maple Tree Ct, Cincinnati, OH 45236 and is currently estimated at $284,975, approximately $181 per square foot. 2621 Maple Tree Ct is a home located in Hamilton County with nearby schools including Reading Community High School, Linden Grove School, and Mount Notre Dame High School.
Ownership History
Date
Name
Owned For
Owner Type
Purchase Details
Closed on
Oct 31, 2002
Sold by
Cloyd Shirley and Brice Mary
Bought by
Feld James Scott and Feld Kelly M
Current Estimated Value
Home Financials for this Owner
Home Financials are based on the most recent Mortgage that was taken out on this home.
Original Mortgage
$123,500
Interest Rate
6.23%
Purchase Details
Closed on
Mar 28, 2001
Sold by
Ashorn Robert E and Ashorn Rebecca M
Bought by
Cloyd Shirley A and Brice Mary L
Home Financials for this Owner
Home Financials are based on the most recent Mortgage that was taken out on this home.
Original Mortgage
$85,000
Interest Rate
7.13%
Purchase Details
Closed on
Aug 6, 1994
Sold by
Charles Timothy W and Charles Lisa
Bought by
Ashorn Robert E
Home Financials for this Owner
Home Financials are based on the most recent Mortgage that was taken out on this home.
Original Mortgage
$87,400
Interest Rate
8.62%
Create a Home Valuation Report for This Property
The Home Valuation Report is an in-depth analysis detailing your home's value as well as a comparison with similar homes in the area
Home Values in the Area
Average Home Value in this Area
Purchase History
| Date | Buyer | Sale Price | Title Company |
|---|---|---|---|
| Feld James Scott | $130,000 | -- | |
| Cloyd Shirley A | $125,000 | Title First Agency Inc | |
| Ashorn Robert E | -- | -- |
Source: Public Records
Mortgage History
| Date | Status | Borrower | Loan Amount |
|---|---|---|---|
| Previous Owner | Feld James Scott | $123,500 | |
| Previous Owner | Cloyd Shirley A | $85,000 | |
| Previous Owner | Ashorn Robert E | $87,400 |
Source: Public Records
Tax History
| Year | Tax Paid | Tax Assessment Tax Assessment Total Assessment is a certain percentage of the fair market value that is determined by local assessors to be the total taxable value of land and additions on the property. | Land | Improvement |
|---|---|---|---|---|
| 2025 | $3,650 | $68,849 | $12,572 | $56,277 |
| 2023 | $3,617 | $68,849 | $12,572 | $56,277 |
| 2022 | $3,547 | $52,318 | $10,759 | $41,559 |
| 2021 | $2,961 | $52,318 | $10,759 | $41,559 |
| 2020 | $2,993 | $52,318 | $10,759 | $41,559 |
| 2019 | $2,731 | $43,600 | $8,967 | $34,633 |
| 2018 | $2,734 | $43,600 | $8,967 | $34,633 |
| 2017 | $2,577 | $43,600 | $8,967 | $34,633 |
| 2016 | $2,841 | $48,220 | $10,507 | $37,713 |
| 2015 | $2,867 | $48,220 | $10,507 | $37,713 |
| 2014 | $2,508 | $48,220 | $10,507 | $37,713 |
| 2013 | $2,542 | $49,204 | $10,721 | $38,483 |
Source: Public Records
Map
Nearby Homes
- 2590 Hunt Rd
- 3558 Lobelia Dr
- 148 Sylvia Ln
- 3595 Cooper Rd
- 2258 Hunt Rd
- 3490 Cooper Rd
- 1283 Alwil Dr
- 1320 Thurnridge Dr
- 1357 Thurnridge Dr
- 134 W Crest Dr
- 4041 Larchview Dr
- 1128 Oldwick Dr
- 103 W Crest Dr
- 4068 Glenbar Ct
- 4053 Belfast Ave
- 1904 Hunt Rd
- 4152 Larchview Dr
- 8608 Dundalk Ct
- 3647 Guam Ct
- 112 Bentwood Ct
- 2617 Maple Tree Ct
- 2625 Maple Tree Ct
- 2613 Maple Tree Ct
- 95 Waxwing Dr
- 2622 Hunt Rd
- 2609 Maple Tree Ct
- 2622 Maple Tree Ct
- 2626 Maple Tree Ct
- 2618 Hunt Rd
- 99 Waxwing Dr
- 2618 Maple Tree Ct
- 2630 Maple Tree Ct
- 2614 Maple Tree Ct
- 2605 Maple Tree Ct
- 2614 Hunt Rd
- 2701 Maple Tree Ct
- 2610 Maple Tree Ct
- 85 Waxwing Dr
- 2601 Maple Tree Ct
- 10 Sugarmaple Ct
Your Personal Tour Guide
Ask me questions while you tour the home.