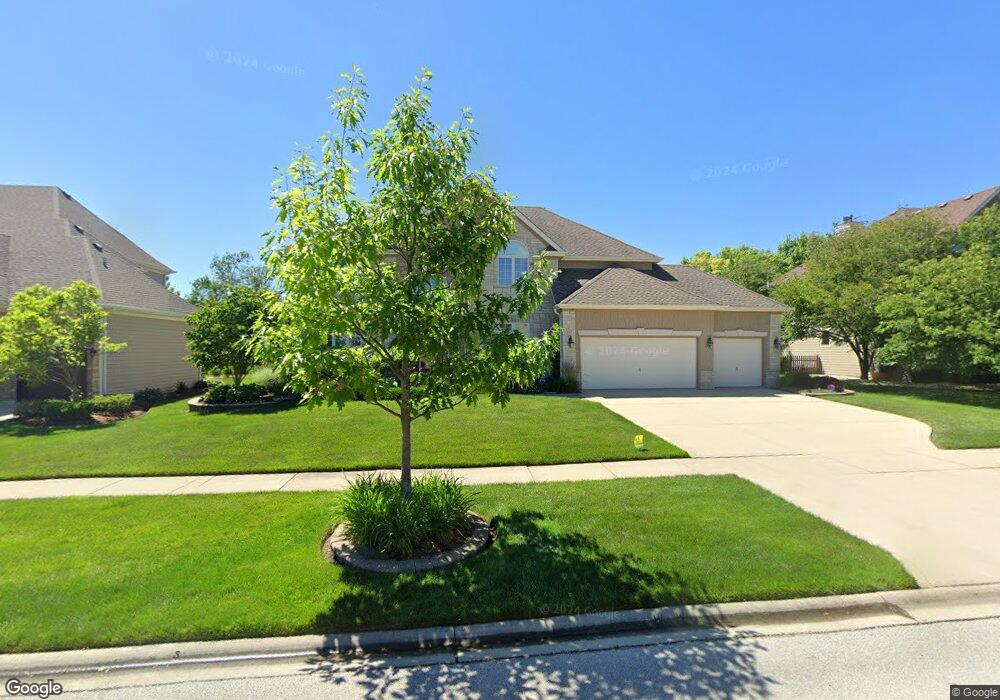
2623 Saddlebrook Dr Naperville, IL 60564
White Eagle NeighborhoodEstimated Value: $864,332 - $969,000
--
Bed
1
Bath
3,550
Sq Ft
$255/Sq Ft
Est. Value
About This Home
This home is located at 2623 Saddlebrook Dr, Naperville, IL 60564 and is currently estimated at $905,777, approximately $255 per square foot. 2623 Saddlebrook Dr is a home located in Will County with nearby schools including White Eagle Elementary School, Still Middle School, and Waubonsie Valley High School.
Ownership History
Date
Name
Owned For
Owner Type
Purchase Details
Closed on
Dec 9, 2002
Sold by
Santillan Jose and Santillan Jazmin
Bought by
Santillan Jazmin and Jazmin Santillan Trust
Current Estimated Value
Purchase Details
Closed on
Jun 17, 1998
Sold by
Budde Mark R and Budde Katherine J
Bought by
Santillan Jose and Santillan Jazmin
Home Financials for this Owner
Home Financials are based on the most recent Mortgage that was taken out on this home.
Original Mortgage
$150,000
Interest Rate
7.22%
Purchase Details
Closed on
Jun 17, 1997
Sold by
Roberts Construction Inc
Bought by
Budde Mark R and Budde Katherine J
Home Financials for this Owner
Home Financials are based on the most recent Mortgage that was taken out on this home.
Original Mortgage
$250,000
Interest Rate
6.5%
Purchase Details
Closed on
Aug 14, 1996
Sold by
The Macom Corp
Bought by
Roberts Construction Inc
Create a Home Valuation Report for This Property
The Home Valuation Report is an in-depth analysis detailing your home's value as well as a comparison with similar homes in the area
Home Values in the Area
Average Home Value in this Area
Purchase History
| Date | Buyer | Sale Price | Title Company |
|---|---|---|---|
| Santillan Jazmin | -- | -- | |
| Santillan Jose | $425,666 | Collar Counties Title Plant | |
| Budde Mark R | $404,500 | Chicago Title Insurance Co | |
| Roberts Construction Inc | $94,000 | Chicago Title Insurance Co |
Source: Public Records
Mortgage History
| Date | Status | Borrower | Loan Amount |
|---|---|---|---|
| Closed | Santillan Jose | $150,000 | |
| Previous Owner | Budde Mark R | $250,000 |
Source: Public Records
Tax History Compared to Growth
Tax History
| Year | Tax Paid | Tax Assessment Tax Assessment Total Assessment is a certain percentage of the fair market value that is determined by local assessors to be the total taxable value of land and additions on the property. | Land | Improvement |
|---|---|---|---|---|
| 2024 | $15,476 | $252,285 | $73,630 | $178,655 |
| 2023 | $15,476 | $222,866 | $65,044 | $157,822 |
| 2022 | $14,472 | $210,739 | $61,531 | $149,208 |
| 2021 | $13,818 | $200,704 | $58,601 | $142,103 |
| 2020 | $13,914 | $197,523 | $57,672 | $139,851 |
| 2019 | $13,679 | $191,957 | $56,047 | $135,910 |
| 2018 | $13,725 | $189,221 | $54,815 | $134,406 |
| 2017 | $13,518 | $184,336 | $53,400 | $130,936 |
| 2016 | $13,495 | $180,367 | $52,250 | $128,117 |
| 2015 | $13,835 | $173,429 | $50,240 | $123,189 |
| 2014 | $13,835 | $171,434 | $50,240 | $121,194 |
| 2013 | $13,835 | $171,434 | $50,240 | $121,194 |
Source: Public Records
Map
Nearby Homes
- 3592 Scottsdale Cir
- 3536 Scottsdale Cir
- 3310 Rosecroft Ln
- 3316 Club Ct
- 3516 Fairmont Ave
- 3349 Rosecroft Ln Unit 2
- 2503 Sheehan Dr Unit 104
- 2255 Palmer Cir
- 2247 Palmer Cir
- 2627 Foxglove St
- 2811 Haven Ct
- 2809 Alameda Ct
- 2611 Cedar Glade Dr Unit 204
- 2611 Cedar Glade Dr Unit 201
- 2624 Cranbrook St
- 2615 Cranbrook St
- 2219 Waterleaf Ct Unit 203
- 2924 Raleigh Ct
- 2851 Normandy Cir Unit 2851
- 2211 Waterleaf Ct Unit 204
- 2631 Saddlebrook Dr
- 2619 Saddlebrook Dr
- 2624 Deering Bay Dr Unit 20
- 2616 Deering Bay Dr
- 2628 Deering Bay Dr
- 2612 Deering Bay Dr
- 2615 Saddlebrook Dr
- 2624 Saddlebrook Dr
- 2628 Saddlebrook Dr
- 2635 Saddlebrook Dr
- 2608 Deering Bay Dr Unit 20
- 2620 Saddlebrook Dr
- 2632 Saddlebrook Dr Unit 20
- 2611 Saddlebrook Dr
- 2616 Saddlebrook Dr Unit 18
- 2604 Deering Bay Dr
- 2636 Saddlebrook Dr
- 3320 Scottsdale Ct
- 2640 Saddlebrook Dr
- 2608 Saddlebrook Dr