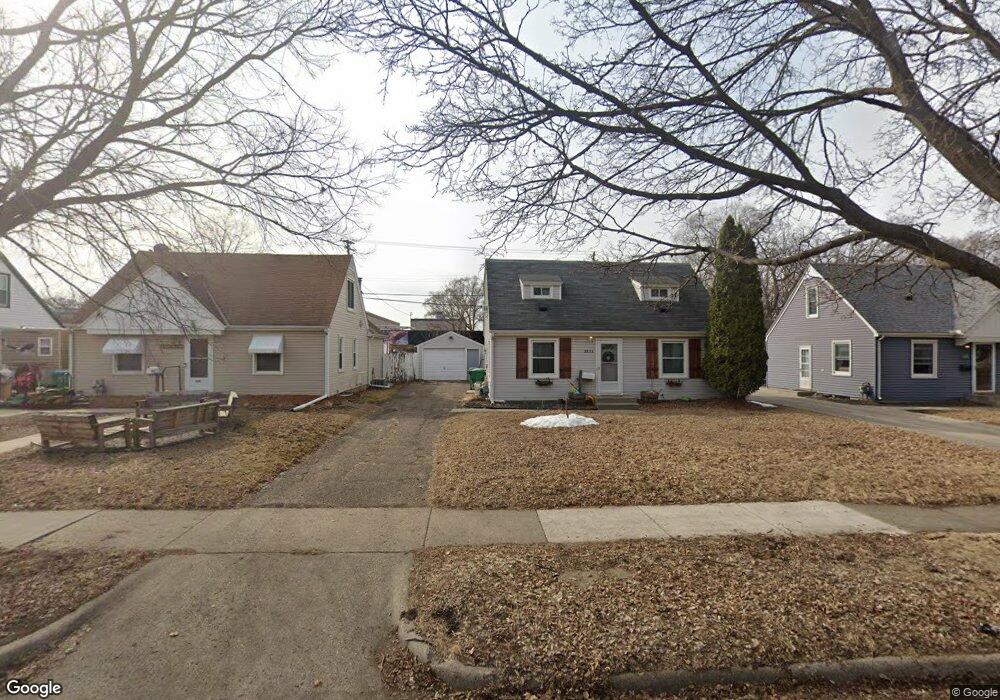
2624 Kentucky Ave S Saint Louis Park, MN 55426
Bronx Park NeighborhoodEstimated Value: $454,000 - $479,000
4
Beds
3
Baths
1,180
Sq Ft
$399/Sq Ft
Est. Value
About This Home
This home is located at 2624 Kentucky Ave S, Saint Louis Park, MN 55426 and is currently estimated at $470,610, approximately $398 per square foot. 2624 Kentucky Ave S is a home located in Hennepin County with nearby schools including Peter Hobart Elementary School, St. Louis Park Middle School, and St. Louis Park High School.
Ownership History
Date
Name
Owned For
Owner Type
Purchase Details
Closed on
Sep 4, 2018
Sold by
Engler Derek and Engler Gabrielle
Bought by
Biatek Alison and Biatek Jason
Current Estimated Value
Home Financials for this Owner
Home Financials are based on the most recent Mortgage that was taken out on this home.
Original Mortgage
$323,380
Outstanding Balance
$281,426
Interest Rate
4.5%
Mortgage Type
New Conventional
Estimated Equity
$189,184
Purchase Details
Closed on
Aug 28, 2018
Sold by
Engler Bonnie and Engler Edward
Bought by
Engler Derek
Home Financials for this Owner
Home Financials are based on the most recent Mortgage that was taken out on this home.
Original Mortgage
$323,380
Outstanding Balance
$281,426
Interest Rate
4.5%
Mortgage Type
New Conventional
Estimated Equity
$189,184
Purchase Details
Closed on
Mar 11, 2014
Sold by
Raimis Construction Llc
Bought by
Engler Derek and Engler Bonnie
Home Financials for this Owner
Home Financials are based on the most recent Mortgage that was taken out on this home.
Original Mortgage
$234,000
Interest Rate
4.35%
Mortgage Type
New Conventional
Purchase Details
Closed on
Jun 17, 2013
Sold by
Enger Michael J
Bought by
Raimis Construction Llc
Create a Home Valuation Report for This Property
The Home Valuation Report is an in-depth analysis detailing your home's value as well as a comparison with similar homes in the area
Home Values in the Area
Average Home Value in this Area
Purchase History
| Date | Buyer | Sale Price | Title Company |
|---|---|---|---|
| Biatek Alison | $340,400 | Burnet Title | |
| Engler Derek | -- | Burnet Title | |
| Engler Derek | $260,000 | Burnet Title | |
| Raimis Construction Llc | $150,441 | Multiple | |
| -- | $155,000 | -- |
Source: Public Records
Mortgage History
| Date | Status | Borrower | Loan Amount |
|---|---|---|---|
| Open | Biatek Alison | $323,380 | |
| Previous Owner | Engler Derek | $234,000 |
Source: Public Records
Tax History Compared to Growth
Tax History
| Year | Tax Paid | Tax Assessment Tax Assessment Total Assessment is a certain percentage of the fair market value that is determined by local assessors to be the total taxable value of land and additions on the property. | Land | Improvement |
|---|---|---|---|---|
| 2024 | $6,194 | $447,000 | $144,100 | $302,900 |
| 2023 | $5,841 | $438,300 | $141,300 | $297,000 |
| 2022 | $4,584 | $408,200 | $140,600 | $267,600 |
| 2021 | $4,365 | $347,600 | $122,300 | $225,300 |
| 2020 | $4,343 | $335,300 | $116,500 | $218,800 |
| 2019 | $4,181 | $321,400 | $111,000 | $210,400 |
| 2018 | $4,221 | $300,700 | $105,800 | $194,900 |
| 2017 | $3,645 | $265,000 | $83,700 | $181,300 |
| 2016 | $3,632 | $255,500 | $75,600 | $179,900 |
| 2015 | $3,664 | $250,600 | $70,700 | $179,900 |
| 2014 | -- | $166,500 | $67,100 | $99,400 |
Source: Public Records
Map
Nearby Homes
- 2620 Kentucky Ave S
- 2608 Kentucky Ave S
- 2622 Idaho Ave S
- 6926 W 24th St
- 2732 Idaho Ave S
- 6821 W 24th St
- 2700 Georgia Ave S
- 7009 Cedar Lake Rd S
- 2849 Jersey Ave S
- 2852 Hampshire Ave S
- 2575 Quebec Ave S
- 2707 Edgewood Ave S
- 2744 Dakota Ave S
- 2054 Louisiana Ave S
- 2925 Georgia Ave S
- 7217 Minnetonka Blvd
- 7907 W 25th St
- 2910 Edgewood Ave S
- 2016 Kentucky Ave S
- 7414 W 22nd St Unit 114
- 2628 Kentucky Ave S
- 2616 Kentucky Ave S
- 2632 Kentucky Ave S
- 2624 2624 Kentucky Ave S
- 2620 2620 Kentucky-Avenue-s
- 2631 2631 Kentucky-Avenue-s
- 2632 2632 Kentucky Ave S
- 2612 Kentucky Ave S
- 2636 Kentucky Ave S
- 2621 Kentucky Ave S
- 2625 Kentucky Ave S
- 2640 Kentucky Ave S
- 2615 Kentucky Ave S
- 2631 Kentucky Ave S
- 2635 Kentucky Ave S
- 2611 Kentucky Ave S
- 2635 Kentucky Ave S
- 2604 Kentucky Ave S
- 2644 Kentucky Ave S
- 2605 Kentucky Ave S