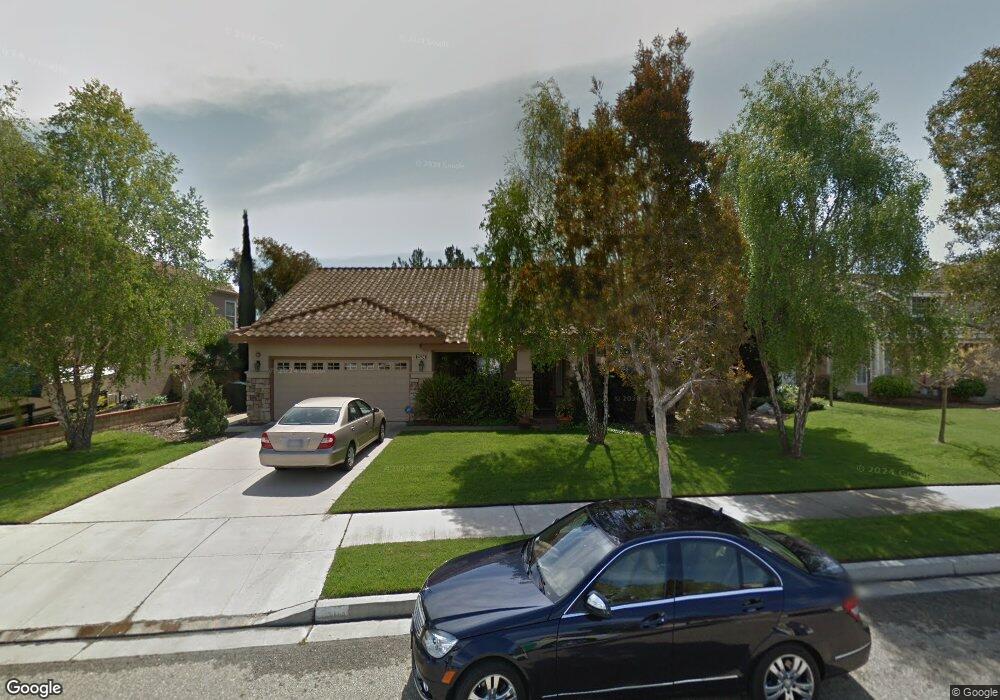
2624 Vista Loop Oxnard, CA 93036
South Bank NeighborhoodEstimated Value: $868,954 - $945,000
3
Beds
2
Baths
1,689
Sq Ft
$539/Sq Ft
Est. Value
About This Home
This home is located at 2624 Vista Loop, Oxnard, CA 93036 and is currently estimated at $910,239, approximately $538 per square foot. 2624 Vista Loop is a home located in Ventura County with nearby schools including Rio Del Norte Elementary School, Rio Vista Middle School, and Rio Mesa High School.
Ownership History
Date
Name
Owned For
Owner Type
Purchase Details
Closed on
Jul 5, 2018
Sold by
Schoenbaum Susan Adaure Olson
Bought by
Schoenbaum Susan Adaire Olson and Olson John Scott
Current Estimated Value
Home Financials for this Owner
Home Financials are based on the most recent Mortgage that was taken out on this home.
Original Mortgage
$877,500
Outstanding Balance
$752,614
Interest Rate
4.6%
Mortgage Type
Reverse Mortgage Home Equity Conversion Mortgage
Estimated Equity
$157,625
Purchase Details
Closed on
May 29, 2008
Sold by
Olson Schoenbaum Susan
Bought by
Olson Schoenbaum Susan Adaire
Purchase Details
Closed on
May 29, 2002
Sold by
Krueger Brian W and Krueger Nancy M
Bought by
Olson Schoenbaum Susan
Home Financials for this Owner
Home Financials are based on the most recent Mortgage that was taken out on this home.
Original Mortgage
$197,000
Interest Rate
6.86%
Create a Home Valuation Report for This Property
The Home Valuation Report is an in-depth analysis detailing your home's value as well as a comparison with similar homes in the area
Home Values in the Area
Average Home Value in this Area
Purchase History
| Date | Buyer | Sale Price | Title Company |
|---|---|---|---|
| Schoenbaum Susan Adaire Olson | -- | None Available | |
| Olson Schoenbaum Susan Adaire | -- | None Available | |
| Olson Schoenbaum Susan | $397,000 | American Title Co |
Source: Public Records
Mortgage History
| Date | Status | Borrower | Loan Amount |
|---|---|---|---|
| Open | Schoenbaum Susan Adaire Olson | $877,500 | |
| Closed | Olson Schoenbaum Susan | $197,000 |
Source: Public Records
Tax History
| Year | Tax Paid | Tax Assessment Tax Assessment Total Assessment is a certain percentage of the fair market value that is determined by local assessors to be the total taxable value of land and additions on the property. | Land | Improvement |
|---|---|---|---|---|
| 2025 | $6,892 | $586,461 | $234,582 | $351,879 |
| 2024 | $6,892 | $574,962 | $229,982 | $344,980 |
| 2023 | $6,618 | $563,689 | $225,473 | $338,216 |
| 2022 | $6,427 | $552,637 | $221,052 | $331,585 |
| 2021 | $6,539 | $541,801 | $216,717 | $325,084 |
| 2020 | $6,675 | $536,247 | $214,496 | $321,751 |
| 2019 | $6,407 | $525,734 | $210,291 | $315,443 |
| 2018 | $6,192 | $515,426 | $206,168 | $309,258 |
| 2017 | $6,029 | $505,321 | $202,126 | $303,195 |
| 2016 | $5,726 | $495,413 | $198,163 | $297,250 |
| 2015 | $5,864 | $487,974 | $195,188 | $292,786 |
| 2014 | $5,608 | $478,000 | $192,000 | $286,000 |
Source: Public Records
Map
Nearby Homes
- 2716 Windcrest Ct
- 2870 Wagon Wheel Rd Unit 203
- 2485 Elderberry Dr Unit 43
- 2820 Wagon Wheel Rd Unit 302
- 2820 Wagon Wheel Rd Unit 403
- 2800 Wagon Wheel Rd Unit 304
- 2810 Wagon Wheel Rd Unit 304
- 2455 Blueberry Dr Unit 120
- 2475 Apple Ln Unit 129
- 905 Kumquat Place
- 2408 Apple Ln Unit 154
- 901 Indigo Place
- 643 Holly Ave
- 1340 Kumquat Place
- 550 Holly Ave
- 2715 Smokey Mountain Dr
- 629 Forest Park Blvd
- 1361 Gardenia St
- 3014 N Oxnard Blvd
- 613 Flathead River St
- 2626 Vista Loop
- 2620 Vista Loop
- 2673 Honeysuckle Dr
- 2618 Vista Loop
- 2671 Honeysuckle Dr
- 2623 Vista Loop
- 2625 Vista Loop
- 2621 Vista Loop
- 2627 Vista Loop
- 2676 Honeysuckle Dr
- 2674 Honeysuckle Dr
- 2669 Honeysuckle Dr
- 2619 Vista Loop
- 2672 Honeysuckle Dr
- 2610 Vista Loop
- 2608 Vista Loop
- 2670 Honeysuckle Dr
- 2606 Vista Loop
- 2750 Windcrest Place
- 2617 Vista Loop
Your Personal Tour Guide
Ask me questions while you tour the home.