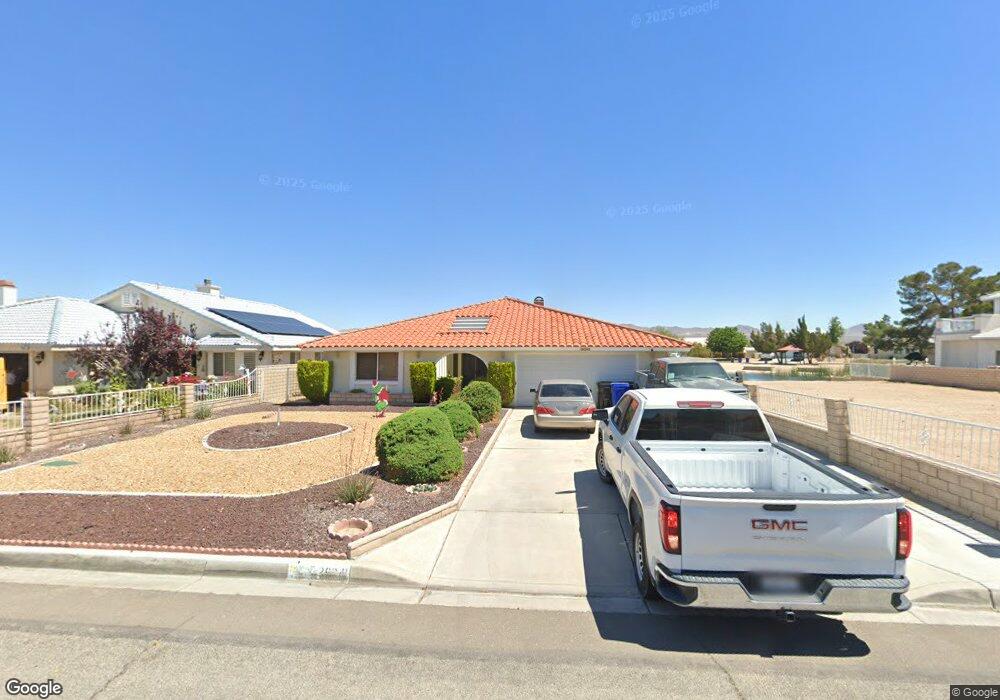
26241 Fleet Ln Helendale, CA 92342
Estimated Value: $334,000 - $352,000
2
Beds
2
Baths
1,498
Sq Ft
$229/Sq Ft
Est. Value
About This Home
This home is located at 26241 Fleet Ln, Helendale, CA 92342 and is currently estimated at $342,388, approximately $228 per square foot. 26241 Fleet Ln is a home located in San Bernardino County with nearby schools including Helendale Elementary School, Riverview Middle School, and Adelanto High School.
Ownership History
Date
Name
Owned For
Owner Type
Purchase Details
Closed on
Apr 3, 2019
Sold by
United States Secretay Of Hsng & Urban D
Bought by
Skipper Matthew B
Current Estimated Value
Home Financials for this Owner
Home Financials are based on the most recent Mortgage that was taken out on this home.
Original Mortgage
$187,847
Outstanding Balance
$165,151
Interest Rate
4.3%
Mortgage Type
New Conventional
Estimated Equity
$177,237
Purchase Details
Closed on
Sep 5, 2018
Sold by
Quality Loan Service Corp
Bought by
United States Secretary Of Hud
Purchase Details
Closed on
Oct 12, 2009
Sold by
Flanigan Wayne H and Flanigan Dorothy E
Bought by
Flanigan Wayne H and Flanigan Dorothy E
Purchase Details
Closed on
Feb 13, 2001
Sold by
Flenigan Wayne H and Flanigan Dorothy E
Bought by
Flanigan Wayne H and Flanigan Dorothy E
Create a Home Valuation Report for This Property
The Home Valuation Report is an in-depth analysis detailing your home's value as well as a comparison with similar homes in the area
Home Values in the Area
Average Home Value in this Area
Purchase History
| Date | Buyer | Sale Price | Title Company |
|---|---|---|---|
| Skipper Matthew B | $198,000 | First American Title | |
| United States Secretary Of Hud | $398,241 | Accommodation | |
| Flanigan Wayne H | -- | Commonwealth Land Title Ins | |
| Flanigan Wayne H | -- | -- |
Source: Public Records
Mortgage History
| Date | Status | Borrower | Loan Amount |
|---|---|---|---|
| Open | Skipper Matthew B | $187,847 |
Source: Public Records
Tax History
| Year | Tax Paid | Tax Assessment Tax Assessment Total Assessment is a certain percentage of the fair market value that is determined by local assessors to be the total taxable value of land and additions on the property. | Land | Improvement |
|---|---|---|---|---|
| 2025 | $2,945 | $220,575 | $44,621 | $175,954 |
| 2024 | $2,749 | $216,250 | $43,746 | $172,504 |
| 2023 | $2,727 | $212,010 | $42,888 | $169,122 |
| 2022 | $2,690 | $207,853 | $42,047 | $165,806 |
| 2021 | $2,639 | $203,778 | $41,223 | $162,555 |
| 2020 | $2,589 | $201,688 | $40,800 | $160,888 |
| 2019 | $3,091 | $235,000 | $47,000 | $188,000 |
| 2018 | $3,347 | $189,090 | $47,274 | $141,816 |
| 2017 | $3,089 | $185,382 | $46,347 | $139,035 |
| 2016 | $2,400 | $181,747 | $45,438 | $136,309 |
| 2015 | $2,278 | $179,017 | $44,755 | $134,262 |
| 2014 | $2,302 | $175,510 | $43,878 | $131,632 |
Source: Public Records
Map
Nearby Homes
- 26223 Fleet Ln
- 26162 Balboa Ct
- 26358 Edgewater Ln
- 26306 Fleet Ln
- 26422 Edgewater Ln
- 26314 Corona Dr
- 26461 Edgewater Ln
- 26299 Driftwood Ln
- 26338 Driftwood Ln
- 26323 Corona Dr
- 26335 Catamaran Ln
- 0 Blue Water Rd Unit HD25172463
- 26489 Blue Water Rd
- 26502 Blue Water Rd
- 14774 Grafton Ln
- 26809 Corona Dr
- 14335 Schooner Dr
- 26590 Cumberland Ln
- 26570 Spar Ln
- 26600 Corona Dr
- 26249 Fleet Ln
- 8319 Fleet Ln
- 0 Fleet Ln Unit 449372
- 0 Fleet Ln Unit 3 453790
- 0 Fleet Ln
- 26257 Fleet Ln
- 26265 Fleet Ln
- 26242 Fleet Ln
- 26213 Fleet Ln
- 26234 Fleet Ln
- 26250 Fleet Ln
- 26226 Fleet Ln
- 26258 Fleet Ln
- 26210 Corona Dr
- 14574 Schooner Dr
- 26273 Fleet Ln
- 26218 Fleet Ln
- 26266 Fleet Ln
- 26218 Corona Dr
- 26226 Corona Dr
Your Personal Tour Guide
Ask me questions while you tour the home.