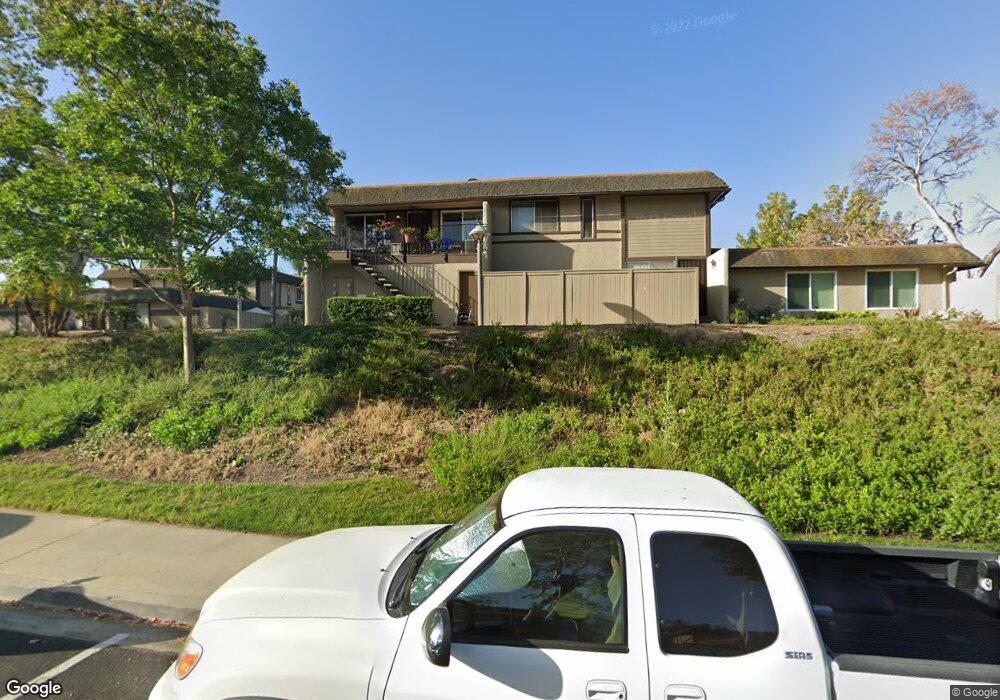
26248 Via Roble Unit 48 Mission Viejo, CA 92691
Estimated Value: $512,336 - $587,000
2
Beds
2
Baths
940
Sq Ft
$599/Sq Ft
Est. Value
About This Home
This home is located at 26248 Via Roble Unit 48, Mission Viejo, CA 92691 and is currently estimated at $562,834, approximately $598 per square foot. 26248 Via Roble Unit 48 is a home located in Orange County with nearby schools including Glen Yermo Elementary School, Los Alisos Intermediate School, and Mission Viejo High School.
Ownership History
Date
Name
Owned For
Owner Type
Purchase Details
Closed on
May 2, 2011
Sold by
Via Roble Trust #26248
Bought by
Gonzalez Monica
Current Estimated Value
Home Financials for this Owner
Home Financials are based on the most recent Mortgage that was taken out on this home.
Original Mortgage
$159,842
Outstanding Balance
$109,118
Interest Rate
4.5%
Mortgage Type
FHA
Estimated Equity
$453,716
Purchase Details
Closed on
Oct 21, 2010
Sold by
Batalo Dustin A and Batalo Kimberly R
Bought by
Via Roble Trust #26248 and T D Bancorp Llc
Purchase Details
Closed on
May 13, 1998
Sold by
Berg Colleen M and Berg Colleen M
Bought by
Walker Steve Jay and Walker Gabriella
Home Financials for this Owner
Home Financials are based on the most recent Mortgage that was taken out on this home.
Original Mortgage
$97,100
Interest Rate
7.13%
Mortgage Type
FHA
Create a Home Valuation Report for This Property
The Home Valuation Report is an in-depth analysis detailing your home's value as well as a comparison with similar homes in the area
Home Values in the Area
Average Home Value in this Area
Purchase History
| Date | Buyer | Sale Price | Title Company |
|---|---|---|---|
| Gonzalez Monica | $164,000 | -- | |
| Via Roble Trust #26248 | $126,675 | None Available | |
| Walker Steve Jay | $100,000 | Landwood Title Company |
Source: Public Records
Mortgage History
| Date | Status | Borrower | Loan Amount |
|---|---|---|---|
| Open | Gonzalez Monica | $159,842 | |
| Previous Owner | Walker Steve Jay | $97,100 |
Source: Public Records
Tax History Compared to Growth
Tax History
| Year | Tax Paid | Tax Assessment Tax Assessment Total Assessment is a certain percentage of the fair market value that is determined by local assessors to be the total taxable value of land and additions on the property. | Land | Improvement |
|---|---|---|---|---|
| 2025 | $2,062 | $210,106 | $136,909 | $73,197 |
| 2024 | $2,062 | $205,987 | $134,225 | $71,762 |
| 2023 | $2,012 | $201,949 | $131,594 | $70,355 |
| 2022 | $1,975 | $197,990 | $129,014 | $68,976 |
| 2021 | $1,934 | $194,108 | $126,484 | $67,624 |
| 2020 | $1,916 | $192,118 | $125,187 | $66,931 |
| 2019 | $1,877 | $188,351 | $122,732 | $65,619 |
| 2018 | $1,841 | $184,658 | $120,325 | $64,333 |
| 2017 | $1,802 | $181,038 | $117,966 | $63,072 |
| 2016 | $1,771 | $177,489 | $115,653 | $61,836 |
| 2015 | $1,749 | $174,823 | $113,915 | $60,908 |
| 2014 | $1,710 | $171,399 | $111,684 | $59,715 |
Source: Public Records
Map
Nearby Homes
- 26368 Via Roble Unit 24
- 26258 Via Roble Unit 36
- 26328 Via Roble Unit 28
- 22922 Vía Nuez
- 26331 Via Lara
- 26158 Via Pera Unit E4
- 26451 Via Juanita
- 22642 La Quinta Dr
- 26068 Via Pera
- 23201 Via Mirlo
- 26205 La Real Unit E
- 26191 La Real Unit B
- 22831 Modesto Dr
- 23251 La Glorieta Unit 66
- 23301 La Crescenta
- 23252 La Mar Unit C
- 26152 La Real Unit C400
- 23371 #E 290 Lacrescenta
- 26212 La Real Unit D
- 26171 Sanz Unit D
- 26252 Via Roble Unit 33
- 26252 Via Roble
- 26254 Via Roble Unit 34
- 26246 Via Roble Unit 47
- 26256 Via Roble Unit 35
- 26244 Via Roble Unit 46
- 26242 Via Roble Unit 45
- 26262 Via Roble Unit 37
- 26238 Via Roble Unit 32
- 26238 Via Roble
- 26358 Via Roble Unit 28
- 26378 Via Roble Unit 20
- 26364 Via Roble Unit 22
- 26376 Via Roble Unit 19
- 26354 Via Roble Unit 26
- 26386 Via Roble Unit 15
- 26382 Via Roble
- 26366 Via Roble Unit 23
- 26388 Via Roble Unit 16
- 26384 Via Roble Unit 14