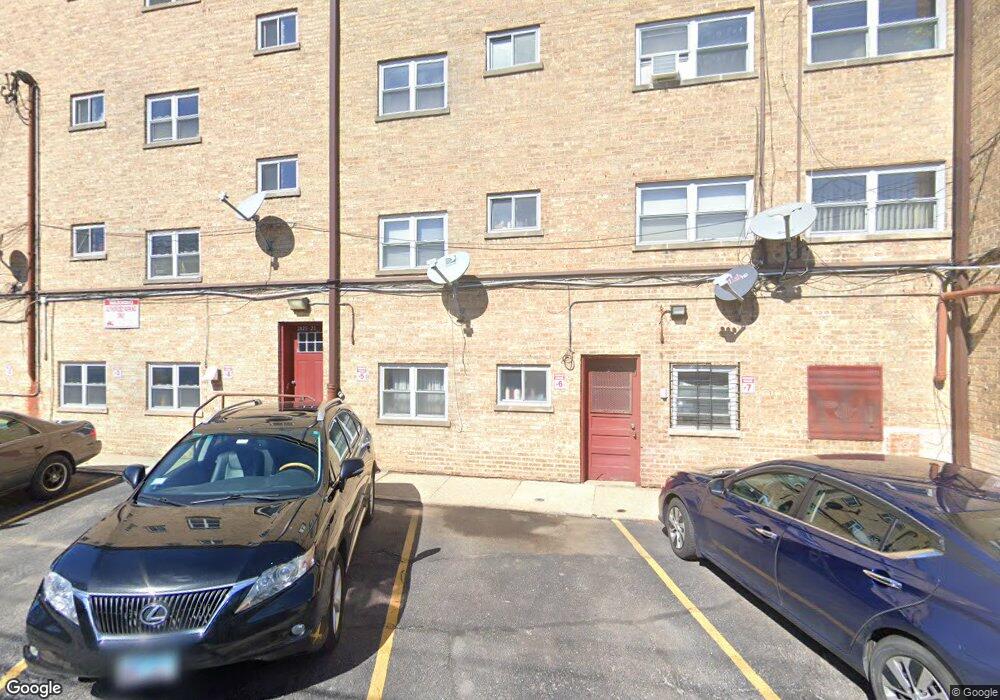
2625 W Fitch Ave Unit 26253 Chicago, IL 60645
West Ridge NeighborhoodEstimated Value: $154,197 - $158,000
2
Beds
1
Bath
800
Sq Ft
$195/Sq Ft
Est. Value
About This Home
This home is located at 2625 W Fitch Ave Unit 26253, Chicago, IL 60645 and is currently estimated at $156,049, approximately $195 per square foot. 2625 W Fitch Ave Unit 26253 is a home located in Cook County with nearby schools including Rogers Elementary School, Mather High School, and Bethesda International Academy.
Ownership History
Date
Name
Owned For
Owner Type
Purchase Details
Closed on
Oct 28, 2011
Sold by
Federal Home Loan Mortgage Corporation
Bought by
Khan Khayyam
Current Estimated Value
Purchase Details
Closed on
Feb 7, 2011
Sold by
Raju Rajesh K
Bought by
Federal Home Loan Mortgage Corp
Purchase Details
Closed on
Apr 12, 2001
Sold by
Ibrahim Khanna
Bought by
Raju Rajesh K and Raju Kamal Nain
Home Financials for this Owner
Home Financials are based on the most recent Mortgage that was taken out on this home.
Original Mortgage
$89,600
Interest Rate
7.03%
Purchase Details
Closed on
Jun 14, 2000
Sold by
Khanna Ibrahim Ishaya K and Khanna Ibrahim
Bought by
Ibrahim Khanna
Home Financials for this Owner
Home Financials are based on the most recent Mortgage that was taken out on this home.
Original Mortgage
$50,000
Interest Rate
8.64%
Purchase Details
Closed on
Aug 27, 1993
Sold by
Parsa Susan G and Azhakh Susan G
Bought by
Khanna Ibrahim Ishaya K and Khanna Ibrahim
Create a Home Valuation Report for This Property
The Home Valuation Report is an in-depth analysis detailing your home's value as well as a comparison with similar homes in the area
Home Values in the Area
Average Home Value in this Area
Purchase History
| Date | Buyer | Sale Price | Title Company |
|---|---|---|---|
| Khan Khayyam | $45,000 | Atgf Inc | |
| Federal Home Loan Mortgage Corp | -- | None Available | |
| Raju Rajesh K | $112,000 | -- | |
| Ibrahim Khanna | -- | Stewart Title | |
| Khanna Ibrahim Ishaya K | -- | -- |
Source: Public Records
Mortgage History
| Date | Status | Borrower | Loan Amount |
|---|---|---|---|
| Previous Owner | Raju Rajesh K | $89,600 | |
| Previous Owner | Ibrahim Khanna | $50,000 |
Source: Public Records
Tax History Compared to Growth
Tax History
| Year | Tax Paid | Tax Assessment Tax Assessment Total Assessment is a certain percentage of the fair market value that is determined by local assessors to be the total taxable value of land and additions on the property. | Land | Improvement |
|---|---|---|---|---|
| 2024 | $2,128 | $10,379 | $1,819 | $8,560 |
| 2023 | $2,074 | $10,087 | $1,455 | $8,632 |
| 2022 | $2,074 | $10,087 | $1,455 | $8,632 |
| 2021 | $2,028 | $10,086 | $1,455 | $8,631 |
| 2020 | $1,599 | $7,178 | $1,055 | $6,123 |
| 2019 | $1,611 | $8,016 | $1,055 | $6,961 |
| 2018 | $1,583 | $8,016 | $1,055 | $6,961 |
| 2017 | $1,275 | $5,925 | $945 | $4,980 |
| 2016 | $1,187 | $5,925 | $945 | $4,980 |
| 2015 | $1,086 | $5,925 | $945 | $4,980 |
| 2014 | $1,656 | $8,927 | $873 | $8,054 |
| 2013 | $1,624 | $8,927 | $873 | $8,054 |
Source: Public Records
Map
Nearby Homes
- 2626 W Lunt Ave
- 2650 W Touhy Ave
- 2545 W Coyle Ave
- 2424 W Estes Ave Unit 3B
- 7229 N Campbell Ave
- 7249 N Campbell Ave Unit B
- 2509 W Morse Ave
- 2335 W Greenleaf Ave Unit 310
- 2416 W Morse Ave
- 2522 W Jarvis Ave
- 6800 N California Ave Unit 3S
- 6800 N California Ave Unit 2I
- 6800 N California Ave Unit 2M
- 7433 N Washtenaw Ave
- 7129 N Oakley Ave
- 2322 W Farwell Ave Unit 1W
- 6734 N Campbell Ave
- 6727 N Maplewood Ave
- 2325 W Farwell Ave Unit 2S
- 2224 W Touhy Ave Unit 3N
- 2627 W Fitch Ave Unit 2627G
- 2627 W Fitch Ave Unit 26273
- 2627 W Fitch Ave Unit 26271
- 2627 W Fitch Ave Unit 26272
- 2627 W Fitch Ave Unit 3G
- 2627 W Fitch Ave Unit 3GW
- 2627 W Fitch Ave Unit 2G
- 2627 W Fitch Ave Unit G
- 2625 W Fitch Ave Unit 26252
- 2625 W Fitch Ave Unit 26251
- 2625 W Fitch Ave
- 2625 W Fitch Ave Unit 3F
- 2625 W Fitch Ave
- 2625 W Fitch Ave Unit 4F
- 2625 W Fitch Ave Unit 3AF
- 2625 W Fitch Ave Unit 1F
- 2629 W Fitch Ave Unit 26293
- 2629 W Fitch Ave Unit 2629G
- 2629 W Fitch Ave Unit 26291
- 2629 W Fitch Ave Unit 26292