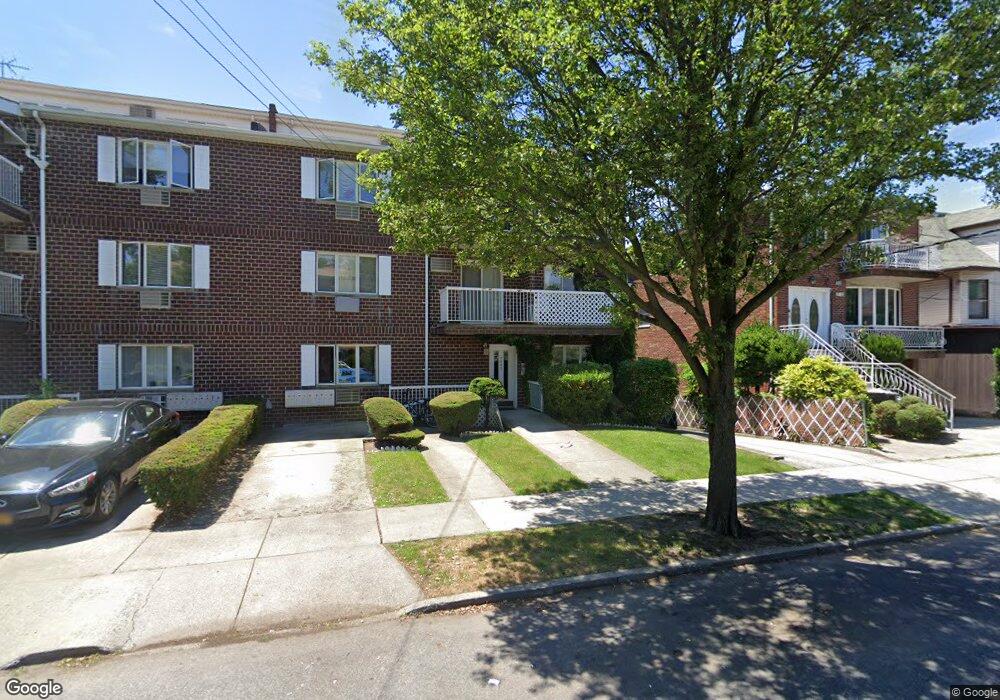
2626 E 26th St Unit 302N Brooklyn, NY 11235
Sheepshead Bay NeighborhoodEstimated Value: $249,000 - $681,000
Studio
--
Bath
783
Sq Ft
$668/Sq Ft
Est. Value
About This Home
This home is located at 2626 E 26th St Unit 302N, Brooklyn, NY 11235 and is currently estimated at $522,657, approximately $667 per square foot. 2626 E 26th St Unit 302N is a home located in Kings County with nearby schools including P.S. 52 Sheepshead Bay, Jhs 14 Shell Bank, and YESHIVAT MEKOR HAIM.
Ownership History
Date
Name
Owned For
Owner Type
Purchase Details
Closed on
Dec 5, 2016
Sold by
Sigalova Maryana
Bought by
Zhivotenko Sergey and Zhivotenko Yevgeniy
Current Estimated Value
Home Financials for this Owner
Home Financials are based on the most recent Mortgage that was taken out on this home.
Original Mortgage
$264,000
Outstanding Balance
$213,307
Interest Rate
3.54%
Mortgage Type
Purchase Money Mortgage
Estimated Equity
$309,350
Purchase Details
Closed on
Mar 30, 2001
Sold by
Golbin Alex
Bought by
Sigalova Maryana
Home Financials for this Owner
Home Financials are based on the most recent Mortgage that was taken out on this home.
Original Mortgage
$170,000
Interest Rate
6.88%
Purchase Details
Closed on
May 13, 1998
Sold by
Schuster Janie
Bought by
Golbin Alex and Itskovich Alice
Home Financials for this Owner
Home Financials are based on the most recent Mortgage that was taken out on this home.
Original Mortgage
$123,200
Interest Rate
7.02%
Create a Home Valuation Report for This Property
The Home Valuation Report is an in-depth analysis detailing your home's value as well as a comparison with similar homes in the area
Home Values in the Area
Average Home Value in this Area
Purchase History
| Date | Buyer | Sale Price | Title Company |
|---|---|---|---|
| Zhivotenko Sergey | $472,000 | -- | |
| Sigalova Maryana | -- | -- | |
| Golbin Alex | $154,000 | Fidelity National Title Ins |
Source: Public Records
Mortgage History
| Date | Status | Borrower | Loan Amount |
|---|---|---|---|
| Open | Zhivotenko Sergey | $264,000 | |
| Previous Owner | Sigalova Maryana | $170,000 | |
| Previous Owner | Golbin Alex | $123,200 |
Source: Public Records
Tax History
| Year | Tax Paid | Tax Assessment Tax Assessment Total Assessment is a certain percentage of the fair market value that is determined by local assessors to be the total taxable value of land and additions on the property. | Land | Improvement |
|---|---|---|---|---|
| 2025 | $3,876 | $26,111 | $1,439 | $24,672 |
| 2024 | $3,876 | $25,635 | $1,439 | $24,196 |
| 2023 | $3,779 | $28,356 | $1,439 | $26,917 |
| 2022 | $3,505 | $26,145 | $1,439 | $24,706 |
| 2021 | $3,485 | $23,118 | $1,439 | $21,679 |
| 2019 | $3,364 | $23,627 | $1,439 | $22,188 |
| 2018 | $3,161 | $15,506 | $990 | $14,516 |
| 2017 | $2,982 | $14,630 | $1,008 | $13,622 |
| 2016 | $2,759 | $13,802 | $1,079 | $12,723 |
| 2015 | $1,445 | $13,401 | $1,068 | $12,333 |
| 2014 | $1,445 | $13,401 | $1,069 | $12,332 |
Source: Public Records
Map
Nearby Homes
- 2679 E 24th St Unit 1B
- 4709 Bedford Ave
- 4641 Bedford Ave Unit 2B
- 2644 E 27th St
- 2711 E 26th St
- 2330 Voorhies Ave Unit LC
- 2601 E 26th St Unit 1A
- 2601 E 24th St Unit 2B
- 2724 E 27th St
- 2726 E 27th St
- 2678 E 28th St
- 2747 E 26th St Unit 101
- 3567 Shore Pkwy Unit H4A
- 2758 E 26th St
- 2733 E 27th St
- 2752 E 27th St Unit A3
- 2315 Avenue Z
- 2310 Jerome Ave
- 2669 E 22nd St
- 2308 Jerome Ave
- 2626 E 26th St Unit 3c
- 2626 E 26th St Unit 303N
- 2626 E 26th St Unit 301N
- 2626 E 26th St Unit 203N
- 2626 E 26th St Unit 202N
- 2626 E 26th St Unit 201N
- 2626 E 26th St Unit 103N
- 2626 E 26th St Unit 101N
- 2626 E 26th St Unit C1N
- 2626 E 26th St Unit 3B
- 2626 E 26th St Unit 3B
- 2626 E 26th St
- 2628 E 26th St
- 2628 E 26th St Unit 303S
- 2628 E 26th St Unit 302S
- 2628 E 26th St Unit 301S
- 2628 E 26th St Unit 203S
- 2628 E 26th St Unit 202S
- 2628 E 26th St Unit 201S
- 2628 E 26th St Unit 103S
Your Personal Tour Guide
Ask me questions while you tour the home.