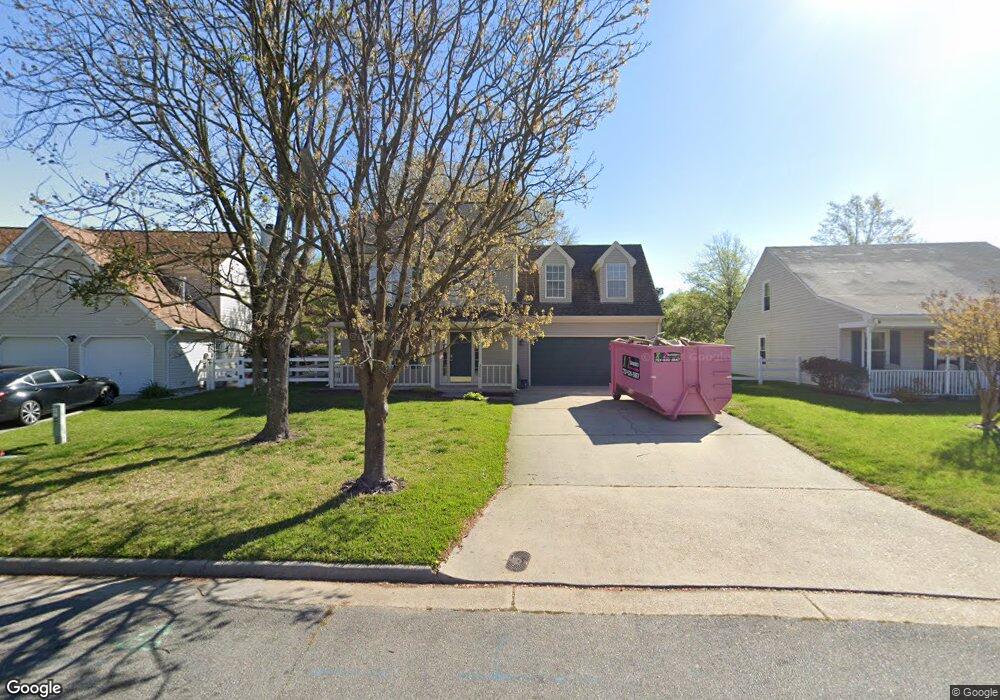
2628 Pulaski Loop Virginia Beach, VA 23456
Princess Anne NeighborhoodEstimated Value: $459,000 - $528,000
4
Beds
3
Baths
1,822
Sq Ft
$276/Sq Ft
Est. Value
About This Home
This home is located at 2628 Pulaski Loop, Virginia Beach, VA 23456 and is currently estimated at $502,183, approximately $275 per square foot. 2628 Pulaski Loop is a home located in Virginia Beach City with nearby schools including North Landing Elementary School, Landstown Middle School, and Floyd E. Kellam High School.
Ownership History
Date
Name
Owned For
Owner Type
Purchase Details
Closed on
Aug 17, 2021
Sold by
Lasseter John A
Bought by
Martinez Christopher and Martinez Bailey Welsh
Current Estimated Value
Home Financials for this Owner
Home Financials are based on the most recent Mortgage that was taken out on this home.
Original Mortgage
$393,855
Outstanding Balance
$358,136
Interest Rate
2.9%
Mortgage Type
VA
Estimated Equity
$144,047
Purchase Details
Closed on
May 21, 2004
Sold by
Ely Jon Robert
Bought by
Lasseter John A
Home Financials for this Owner
Home Financials are based on the most recent Mortgage that was taken out on this home.
Original Mortgage
$194,400
Interest Rate
5.88%
Mortgage Type
New Conventional
Purchase Details
Closed on
Jun 21, 1999
Sold by
Matthews Calvin
Bought by
Ely Jon Robert
Home Financials for this Owner
Home Financials are based on the most recent Mortgage that was taken out on this home.
Original Mortgage
$141,110
Interest Rate
6.99%
Create a Home Valuation Report for This Property
The Home Valuation Report is an in-depth analysis detailing your home's value as well as a comparison with similar homes in the area
Home Values in the Area
Average Home Value in this Area
Purchase History
| Date | Buyer | Sale Price | Title Company |
|---|---|---|---|
| Martinez Christopher | $385,000 | Landmark Title Llc | |
| Lasseter John A | $243,000 | -- | |
| Ely Jon Robert | $137,000 | -- |
Source: Public Records
Mortgage History
| Date | Status | Borrower | Loan Amount |
|---|---|---|---|
| Open | Martinez Christopher | $393,855 | |
| Previous Owner | Lasseter John A | $194,400 | |
| Previous Owner | Ely Jon Robert | $141,110 |
Source: Public Records
Tax History
| Year | Tax Paid | Tax Assessment Tax Assessment Total Assessment is a certain percentage of the fair market value that is determined by local assessors to be the total taxable value of land and additions on the property. | Land | Improvement |
|---|---|---|---|---|
| 2025 | $4,130 | $441,300 | $205,000 | $236,300 |
| 2024 | $4,130 | $425,800 | $192,000 | $233,800 |
Source: Public Records
Map
Nearby Homes
- 2612 Pulaski Loop
- 2609 Loudoun St
- 2521 Alleghany Loop
- 2904 Wilcox Dr
- 2525 Alleghany Loop
- 3000 N Landing Rd Unit 1
- 3984 N Landing Rd
- 2928 Einstein Dr
- 2453 Timber Run
- 2533 Pamlico Loop
- 2712 Coldwell St Unit X5021
- 3225 Fayette Dr
- 2789 Browning Dr
- 2809 Garland Atwater Jr Ct
- 2828 Garland Atwater Jr Ct
- 3237 Fayette Dr
- 3403 Misty Dawn Ct
- 2821 Majestic Oak Ct
- 3543 Winding Trail Cir
- 2824 Rose Garden Way
- 2632 Pulaski Loop
- 2624 Pulaski Loop
- 2636 Pulaski Loop
- 2620 Pulaski Loop
- 2629 Pulaski Loop
- 2625 Pulaski Loop
- 2633 Pulaski Loop
- 2640 Pulaski Loop
- LOT 40 Pulaski Loop
- LOT 70 Pulaski Loop
- 2637 Pulaski Loop
- 2617 Pulaski Loop
- 2644 Pulaski Loop
- 2620 Loudoun St
- 2641 Pulaski Loop
- 2616 Loudoun St
- 2624 Loudoun St
- 2609 Pulaski Loop
- 2612 Loudoun St
- 2648 Pulaski Loop
Your Personal Tour Guide
Ask me questions while you tour the home.