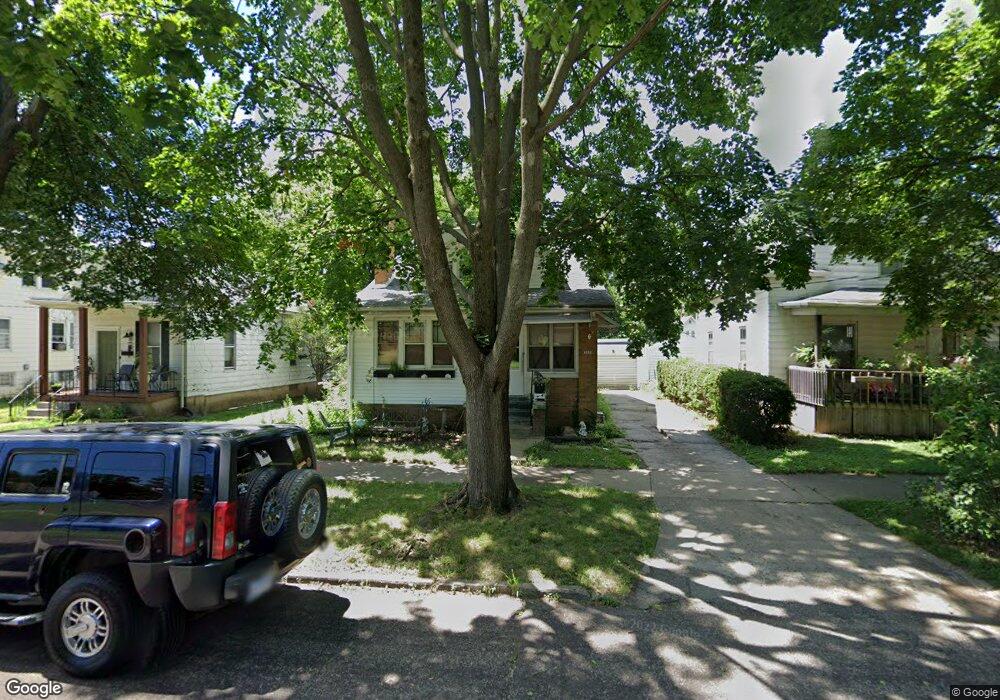
2629 N California Ave Peoria, IL 61603
West Bluff NeighborhoodEstimated Value: $88,000 - $110,000
4
Beds
2
Baths
976
Sq Ft
$102/Sq Ft
Est. Value
About This Home
This home is located at 2629 N California Ave, Peoria, IL 61603 and is currently estimated at $99,699, approximately $102 per square foot. 2629 N California Ave is a home located in Peoria County with nearby schools including Von Steuben Middle School, Peoria High School, and Peoria Christian School.
Ownership History
Date
Name
Owned For
Owner Type
Purchase Details
Closed on
Apr 16, 2021
Sold by
Citizens Equity First Credit Union
Bought by
Land William A
Current Estimated Value
Home Financials for this Owner
Home Financials are based on the most recent Mortgage that was taken out on this home.
Original Mortgage
$60,600
Outstanding Balance
$55,250
Interest Rate
3.63%
Mortgage Type
New Conventional
Estimated Equity
$44,449
Purchase Details
Closed on
Apr 15, 2021
Sold by
Citizens Equity First Credit Union
Bought by
Land William A
Home Financials for this Owner
Home Financials are based on the most recent Mortgage that was taken out on this home.
Original Mortgage
$60,600
Outstanding Balance
$55,250
Interest Rate
3.63%
Mortgage Type
New Conventional
Estimated Equity
$44,449
Purchase Details
Closed on
Nov 6, 2012
Sold by
Holley Donald L
Bought by
Citizens Equity First Credit U
Purchase Details
Closed on
Mar 13, 2008
Bought by
Holley Donald L
Create a Home Valuation Report for This Property
The Home Valuation Report is an in-depth analysis detailing your home's value as well as a comparison with similar homes in the area
Home Values in the Area
Average Home Value in this Area
Purchase History
| Date | Buyer | Sale Price | Title Company |
|---|---|---|---|
| Land William A | $65,000 | None Listed On Document | |
| Land William A | $65,000 | None Listed On Document | |
| Citizens Equity First Credit U | -- | Westervelt Johnson Nicoll & Ke | |
| Holley Donald L | $19,900 | -- |
Source: Public Records
Mortgage History
| Date | Status | Borrower | Loan Amount |
|---|---|---|---|
| Open | Land William A | $60,600 | |
| Closed | Land William A | $60,600 | |
| Closed | Land William A | $6,000 |
Source: Public Records
Tax History Compared to Growth
Tax History
| Year | Tax Paid | Tax Assessment Tax Assessment Total Assessment is a certain percentage of the fair market value that is determined by local assessors to be the total taxable value of land and additions on the property. | Land | Improvement |
|---|---|---|---|---|
| 2024 | $1,708 | $24,880 | $3,350 | $21,530 |
| 2023 | $1,583 | $22,820 | $3,070 | $19,750 |
| 2022 | $1,515 | $21,710 | $3,010 | $18,700 |
| 2021 | $2,056 | $20,680 | $2,870 | $17,810 |
| 2020 | $2,051 | $20,470 | $2,840 | $17,630 |
| 2019 | $2,081 | $20,890 | $2,900 | $17,990 |
| 2018 | $2,143 | $22,000 | $2,930 | $19,070 |
| 2017 | $2,126 | $22,220 | $2,960 | $19,260 |
| 2016 | $2,082 | $22,220 | $2,960 | $19,260 |
| 2015 | $2,178 | $21,780 | $2,900 | $18,880 |
| 2014 | $2,177 | $23,660 | $2,760 | $20,900 |
| 2013 | -- | $23,940 | $2,790 | $21,150 |
Source: Public Records
Map
Nearby Homes
- 600 E Gift Ave
- 410 E Virginia Ave
- 2809 N California Ave
- 600 E Virginia Ave
- 2804 N Peoria Ave
- 618 E Virginia Ave
- 516 E Maywood Ave
- 209 E Corrington Ave
- 720 E Gift Ave
- 3215 Knoxville Ave
- 2606 N Wisconsin Ave
- 417 E Arcadia Ave
- 717 E Maywood Ave
- 201 W Hanssler Place
- 606 E Arcadia Ave
- 108 E Forrest Hill Ave
- 603 E Thrush Ave
- 2624 N Bigelow St
- 900 E Virginia Ave
- 410 E Thrush Ave
- 2633 N California Ave
- 2627 N California Ave
- 2635 N California Ave
- 2625 N California Ave
- 2621 N California Ave
- 2639 N California Ave
- 2628 N Missouri Ave
- 2634 N Missouri Ave
- 2641 N California Ave
- 2632 N Missouri Ave
- 2638 N Missouri Ave
- 2701 N California Ave
- 2700 N Missouri Ave
- 2615 N California Ave
- 2702 N Missouri Ave
- 2705 N California Ave
- 2614 N Missouri Ave
- 2613 N California Ave
- 2700 N California Ave
- 2706 N Missouri Ave