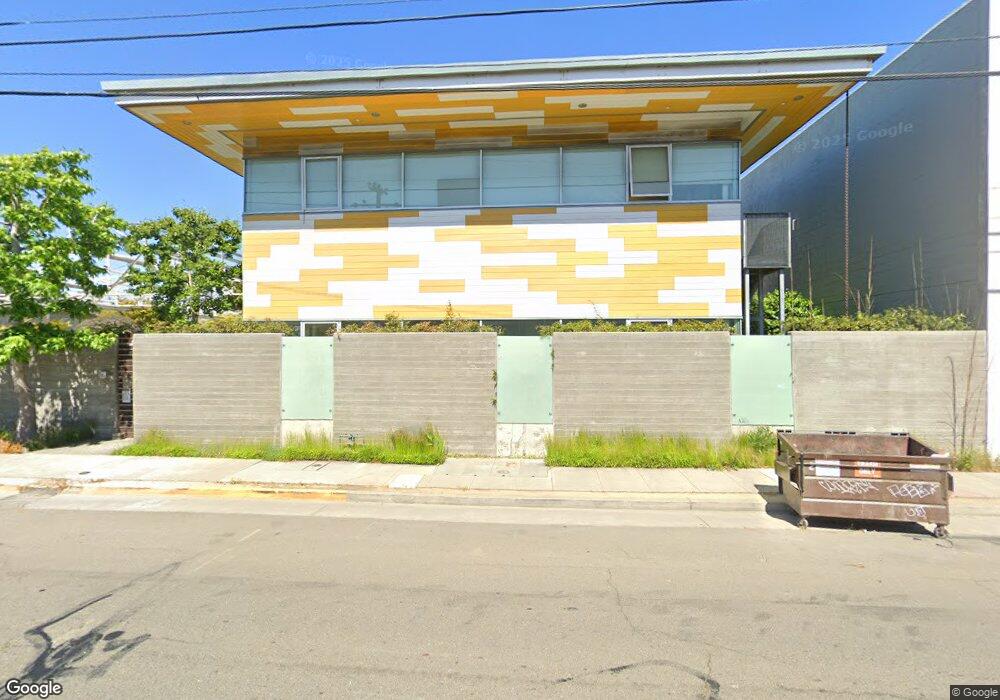
2629 Seventh St Berkeley, CA 94710
West Berkeley Neighborhood
Studio
1
Bath
19,054
Sq Ft
22,651
Sq Ft Lot
About This Home
This home is located at 2629 Seventh St, Berkeley, CA 94710. 2629 Seventh St is a home located in Alameda County with nearby schools including Oxford Elementary School, Malcolm X Elementary School, and Washington Elementary School.
Ownership History
Date
Name
Owned For
Owner Type
Purchase Details
Closed on
Oct 25, 2018
Sold by
Gordon Bruce N
Bought by
Gordon Gordon Bruce N Bruce N and Gordon Bruce N
Purchase Details
Closed on
Jun 8, 2018
Sold by
Maclaughlin Susan A
Bought by
Gordon Bruce N
Purchase Details
Closed on
Jun 6, 2018
Sold by
Berkeley Brass Owner Llc
Bought by
Arlington Investment Company
Purchase Details
Closed on
Jul 27, 2016
Sold by
Berkeley Brass Llc
Bought by
Berkeley Brass Owner Llc
Home Financials for this Owner
Home Financials are based on the most recent Mortgage that was taken out on this home.
Original Mortgage
$3,180,000
Interest Rate
3.54%
Mortgage Type
Commercial
Purchase Details
Closed on
Feb 11, 1999
Sold by
Argos Ltd
Bought by
Berkeley Brass Llc
Create a Home Valuation Report for This Property
The Home Valuation Report is an in-depth analysis detailing your home's value as well as a comparison with similar homes in the area
Home Values in the Area
Average Home Value in this Area
Purchase History
| Date | Buyer | Sale Price | Title Company |
|---|---|---|---|
| Gordon Gordon Bruce N Bruce N | -- | None Available | |
| Gordon Bruce N | -- | Chicago Title Company | |
| Arlington Investment Company | $9,500,000 | Chicago Title Company | |
| Berkeley Brass Owner Llc | $5,300,000 | Chicago Title Company | |
| Berkeley Brass Llc | $612,500 | Chicago Title Co |
Source: Public Records
Mortgage History
| Date | Status | Borrower | Loan Amount |
|---|---|---|---|
| Previous Owner | Berkeley Brass Owner Llc | $3,180,000 |
Source: Public Records
Tax History
| Year | Tax Paid | Tax Assessment Tax Assessment Total Assessment is a certain percentage of the fair market value that is determined by local assessors to be the total taxable value of land and additions on the property. | Land | Improvement |
|---|---|---|---|---|
| 2025 | $140,781 | $9,500,713 | $3,868,554 | $5,632,159 |
| 2024 | $140,781 | $9,314,425 | $3,792,700 | $5,521,725 |
| 2023 | $137,922 | $9,131,810 | $3,718,342 | $5,413,468 |
| 2022 | $135,559 | $8,952,786 | $3,645,446 | $5,307,340 |
| 2021 | $135,878 | $8,777,269 | $3,573,978 | $5,203,291 |
| 2020 | $128,812 | $8,687,340 | $3,537,360 | $5,149,980 |
| 2019 | $124,682 | $8,517,000 | $3,468,000 | $5,049,000 |
| 2018 | $78,978 | $4,794,000 | $1,428,000 | $3,366,000 |
| 2017 | $76,045 | $4,700,000 | $1,400,000 | $3,300,000 |
| 2016 | $53,059 | $2,755,252 | $569,436 | $2,185,816 |
| 2015 | $52,203 | $2,713,878 | $560,883 | $2,152,995 |
| 2014 | $51,315 | $2,660,732 | $549,896 | $2,110,836 |
Source: Public Records
Map
Nearby Homes
- 1010 Grayson St
- 1034 Grayson St
- 1092 Dwight Way
- 2411 Sixth St
- 917 Channing Way
- 1118 Dwight Way
- 2341 9th St
- 2751 Wallace St
- 1142 Dwight Way
- 1144 Dwight Way
- 1039 Channing Way
- 2327 10th St Unit 4
- 2717 Mabel St
- 931 Bancroft Way
- 2238 7th St
- 2241 Ninth St
- 2220 7th St
- 811 Folger Ave
- 2324 Browning St
- 1237 Ashby Ave
Your Personal Tour Guide
Ask me questions while you tour the home.