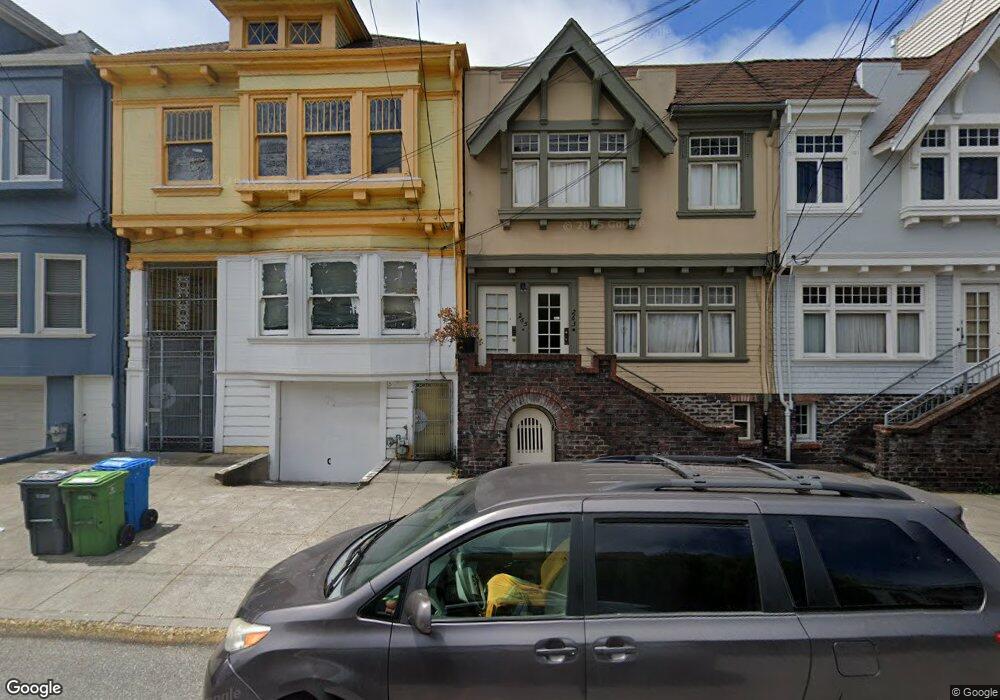
263 8th Ave Unit 265 San Francisco, CA 94118
Inner Richmond NeighborhoodEstimated Value: $1,513,000 - $1,846,478
--
Bed
2
Baths
2,320
Sq Ft
$730/Sq Ft
Est. Value
About This Home
This home is located at 263 8th Ave Unit 265, San Francisco, CA 94118 and is currently estimated at $1,693,620, approximately $730 per square foot. 263 8th Ave Unit 265 is a home located in San Francisco County with nearby schools including George Peabody Elementary, Roosevelt Middle School, and Presidio Hill School.
Ownership History
Date
Name
Owned For
Owner Type
Purchase Details
Closed on
Jul 1, 2025
Sold by
Trust Of Judith Schip and Schip Matthew Theodore
Bought by
Trust Of Judith Schip and Schip
Current Estimated Value
Purchase Details
Closed on
Apr 30, 2025
Sold by
Schip Family Trust and Schip Shu-Yi Kao
Bought by
Schip-Newton Sandra L
Purchase Details
Closed on
Jun 25, 2020
Sold by
Schip Judith E and Schip Grant Judith
Bought by
Schip Judith E
Purchase Details
Closed on
Nov 8, 2019
Sold by
Silva Elisabeth
Bought by
Silva Elisabeth
Purchase Details
Closed on
Oct 25, 2016
Sold by
Silva Elisabeth
Bought by
Silva Elisabeth
Purchase Details
Closed on
Nov 5, 2012
Sold by
Silva Elisabeth and Schip Elizabeth C
Bought by
Silva Anthony and Silva Elisabeth
Purchase Details
Closed on
Oct 12, 2010
Sold by
Schip Owen
Bought by
Schip Owen
Purchase Details
Closed on
Nov 11, 2008
Sold by
Schip Ellen
Bought by
Schip Ellen
Create a Home Valuation Report for This Property
The Home Valuation Report is an in-depth analysis detailing your home's value as well as a comparison with similar homes in the area
Home Values in the Area
Average Home Value in this Area
Purchase History
| Date | Buyer | Sale Price | Title Company |
|---|---|---|---|
| Trust Of Judith Schip | -- | None Listed On Document | |
| Schip-Newton Sandra L | -- | None Listed On Document | |
| Schip Judith E | -- | None Available | |
| Silva Elisabeth | -- | None Available | |
| Silva Elisabeth | -- | None Available | |
| Silva Elisabeth | -- | None Available | |
| Silva Elisabeth | -- | None Available | |
| Silva Anthony | -- | None Available | |
| Silva Anthony | -- | None Available | |
| Schip Owen | -- | None Available | |
| Schip Ellen | -- | None Available |
Source: Public Records
Tax History Compared to Growth
Tax History
| Year | Tax Paid | Tax Assessment Tax Assessment Total Assessment is a certain percentage of the fair market value that is determined by local assessors to be the total taxable value of land and additions on the property. | Land | Improvement |
|---|---|---|---|---|
| 2025 | $2,267 | $110,024 | $53,514 | $56,510 |
| 2024 | $2,267 | $107,872 | $52,468 | $55,404 |
| 2023 | $2,131 | $105,760 | $51,440 | $54,320 |
| 2022 | $2,060 | $103,690 | $50,434 | $53,256 |
| 2021 | $2,020 | $101,662 | $49,448 | $52,214 |
| 2020 | $2,150 | $100,622 | $48,942 | $51,680 |
| 2019 | $2,089 | $98,654 | $47,984 | $50,670 |
| 2018 | $2,017 | $96,694 | $47,028 | $49,666 |
| 2017 | $1,697 | $94,802 | $46,108 | $48,694 |
| 2016 | $1,632 | $92,948 | $45,206 | $47,742 |
| 2015 | $1,606 | $91,554 | $44,528 | $47,026 |
| 2014 | $1,568 | $89,764 | $43,658 | $46,106 |
Source: Public Records
Map
Nearby Homes
- 171 9th Ave Unit 173
- 185 7th Ave
- 4829 California St
- 120 7th Ave
- 236 6th Ave Unit 238
- 4328 Geary Blvd
- 373 6th Ave
- 371 6th Ave
- 154-156 Funston Ave
- 334-336 4th Ave
- 459 11th Ave
- 118-120 15th Ave
- 118 15th Ave
- 432 4th Ave
- 130 2nd Ave
- 3234 Clement St
- 38 Presidio Terrace
- 374 376 Funston Ave
- 550 9th Ave
- 428 15th Ave
- 259 8th Ave Unit 261
- 267 8th Ave
- 255 8th Ave Unit 257
- 271 8th Ave
- 253 8th Ave
- 275 8th Ave Unit 277
- 247 8th Ave
- 245 8th Ave
- 279 8th Ave
- 274 9th Ave
- 262 9th Ave
- 241 8th Ave Unit 243
- 250 9th Ave
- 258 9th Ave Unit 260
- 235 8th Ave Unit 237
- 256 9th Ave
- 244 9th Ave
- 254 9th Ave Unit 256
- 240 9th Ave
- 266 8th Ave