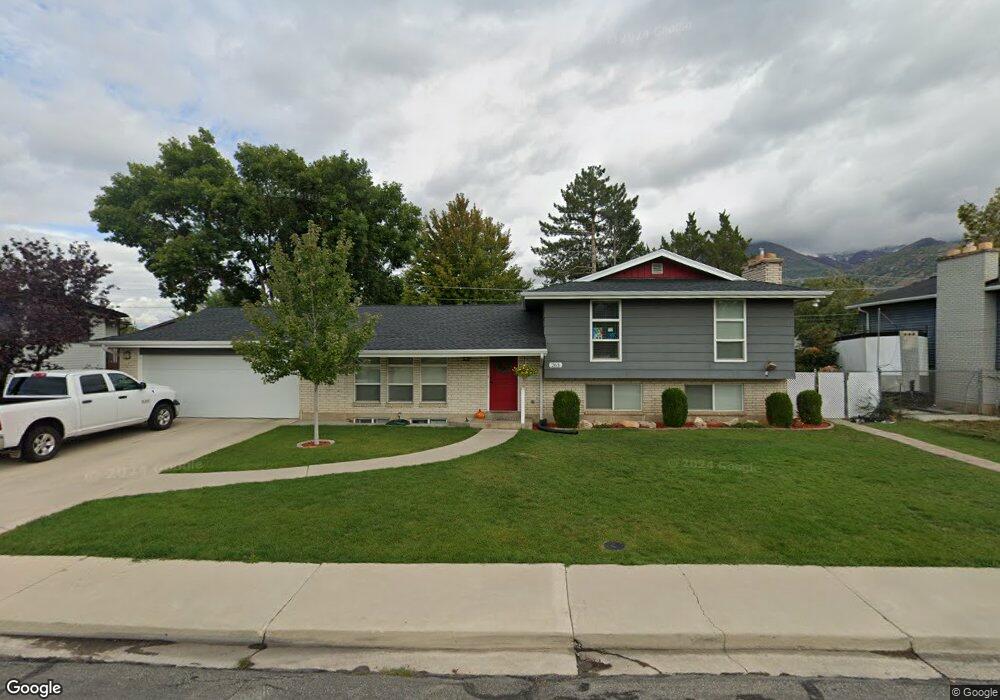
263 E 1165 N Orem, UT 84057
Windsor NeighborhoodEstimated Value: $528,000 - $574,000
5
Beds
3
Baths
2,472
Sq Ft
$223/Sq Ft
Est. Value
About This Home
This home is located at 263 E 1165 N, Orem, UT 84057 and is currently estimated at $551,294, approximately $223 per square foot. 263 E 1165 N is a home located in Utah County with nearby schools including Orchard Elementary School, Canyon View Junior High School, and Timpanogos High School.
Ownership History
Date
Name
Owned For
Owner Type
Purchase Details
Closed on
Jan 24, 2013
Sold by
Walker Edith P
Bought by
Payne Jonathan and Payne Sarah
Current Estimated Value
Home Financials for this Owner
Home Financials are based on the most recent Mortgage that was taken out on this home.
Original Mortgage
$166,250
Outstanding Balance
$115,517
Interest Rate
3.28%
Mortgage Type
New Conventional
Estimated Equity
$435,777
Purchase Details
Closed on
Apr 10, 2002
Sold by
Walker Troy W
Bought by
Walker Bernard William and Walker Edith P
Create a Home Valuation Report for This Property
The Home Valuation Report is an in-depth analysis detailing your home's value as well as a comparison with similar homes in the area
Home Values in the Area
Average Home Value in this Area
Purchase History
| Date | Buyer | Sale Price | Title Company |
|---|---|---|---|
| Payne Jonathan | -- | Gateway Title Insurance | |
| Walker Bernard William | -- | -- |
Source: Public Records
Mortgage History
| Date | Status | Borrower | Loan Amount |
|---|---|---|---|
| Open | Payne Jonathan | $166,250 |
Source: Public Records
Tax History
| Year | Tax Paid | Tax Assessment Tax Assessment Total Assessment is a certain percentage of the fair market value that is determined by local assessors to be the total taxable value of land and additions on the property. | Land | Improvement |
|---|---|---|---|---|
| 2025 | $2,181 | $279,455 | -- | -- |
| 2024 | $2,181 | $266,750 | $0 | $0 |
| 2023 | $2,002 | $263,120 | $0 | $0 |
| 2022 | $2,066 | $263,065 | $0 | $0 |
| 2021 | $1,753 | $338,000 | $141,400 | $196,600 |
| 2020 | $1,613 | $305,800 | $113,100 | $192,700 |
| 2019 | $1,469 | $289,600 | $102,500 | $187,100 |
| 2018 | $1,401 | $263,800 | $98,900 | $164,900 |
| 2017 | $1,332 | $134,365 | $0 | $0 |
| 2016 | $1,331 | $123,805 | $0 | $0 |
| 2015 | $1,263 | $111,100 | $0 | $0 |
| 2014 | $1,217 | $106,535 | $0 | $0 |
Source: Public Records
Map
Nearby Homes
- 372 E 1165 N
- 1371 N 330 E Unit 8
- 917 N Garden Dr
- 363 E 1395 N Unit 22
- 16 E 925 N
- 1480 N 430 E
- 789 200 E Unit 787
- 976 N 560 E
- 362 E 800 N Unit 1
- 125 W 870 N
- 723 E 1450 N Unit 25
- 1636 N 160 E
- 1638 N 160 E
- 710 E 1280 N
- 471 E 700 N
- 713 E 1450 N Unit 23
- 620 N 120 E
- 733 E 1450 N Unit 5
- 287 W 1380 N
- 713 E 1500 St N Unit 19
Your Personal Tour Guide
Ask me questions while you tour the home.