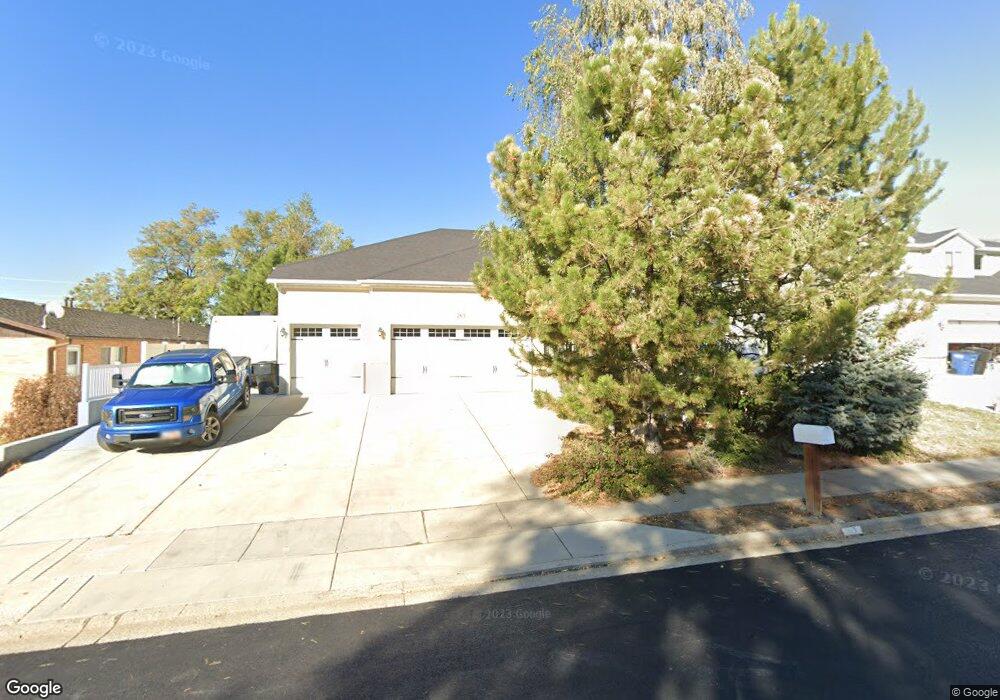
263 E 200 S Unit 4 Bountiful, UT 84010
Estimated Value: $633,000 - $788,339
5
Beds
4
Baths
1,605
Sq Ft
$440/Sq Ft
Est. Value
About This Home
This home is located at 263 E 200 S Unit 4, Bountiful, UT 84010 and is currently estimated at $706,335, approximately $440 per square foot. 263 E 200 S Unit 4 is a home located in Davis County with nearby schools including Holbrook Elementary School, Millcreek Junior High School, and Bountiful High School.
Ownership History
Date
Name
Owned For
Owner Type
Purchase Details
Closed on
Apr 5, 2016
Sold by
Carter Sutherland Homes Llc
Bought by
Carlisle Elizabeth and Brennan Helen
Current Estimated Value
Purchase Details
Closed on
Apr 4, 2016
Sold by
Hoban Investments Llc
Bought by
Carter Sutherland Homes Llc
Create a Home Valuation Report for This Property
The Home Valuation Report is an in-depth analysis detailing your home's value as well as a comparison with similar homes in the area
Purchase History
| Date | Buyer | Sale Price | Title Company |
|---|---|---|---|
| Carlisle Elizabeth | -- | Stewart Title | |
| Carter Sutherland Homes Llc | -- | Stewart Title |
Source: Public Records
Tax History
| Year | Tax Paid | Tax Assessment Tax Assessment Total Assessment is a certain percentage of the fair market value that is determined by local assessors to be the total taxable value of land and additions on the property. | Land | Improvement |
|---|---|---|---|---|
| 2025 | $4,290 | $399,300 | $133,804 | $265,496 |
| 2024 | $3,969 | $380,600 | $120,006 | $260,594 |
| 2023 | $3,809 | $662,000 | $220,402 | $441,598 |
| 2022 | $3,933 | $375,100 | $120,249 | $254,851 |
| 2021 | $3,668 | $536,000 | $157,390 | $378,610 |
| 2020 | $3,429 | $505,000 | $134,191 | $370,809 |
| 2019 | $3,541 | $510,000 | $139,998 | $370,002 |
| 2018 | $3,339 | $474,000 | $137,192 | $336,808 |
| 2016 | $1,445 | $105,555 | $20,673 | $84,882 |
| 2015 | $642 | $38,550 | $37,587 | $963 |
| 2014 | $672 | $42,726 | $41,763 | $963 |
| 2013 | -- | $7,238 | $6,110 | $1,128 |
Source: Public Records
Map
Nearby Homes
- 255 E 400 S
- 357 S 100 E
- 520 S Orchard Dr Unit 17
- 275 E Peach Ln S
- 456 E 500 S
- 545 S 100 E
- 323 Peach Ln
- 32 W 400 S
- 34 W 400 S
- 55 E 200 N Unit 2
- 51 E 200 N Unit 3
- 49 E 200 N Unit 4
- 41 E 200 N Unit 6
- 254 N Main St
- 256 N Main St
- 252 N Main St
- 698 E 200 S
- 650 S Main St Unit 6206
- 650 S Main St Unit 4104
- 650 S Main St Unit 9106
Your Personal Tour Guide
Ask me questions while you tour the home.