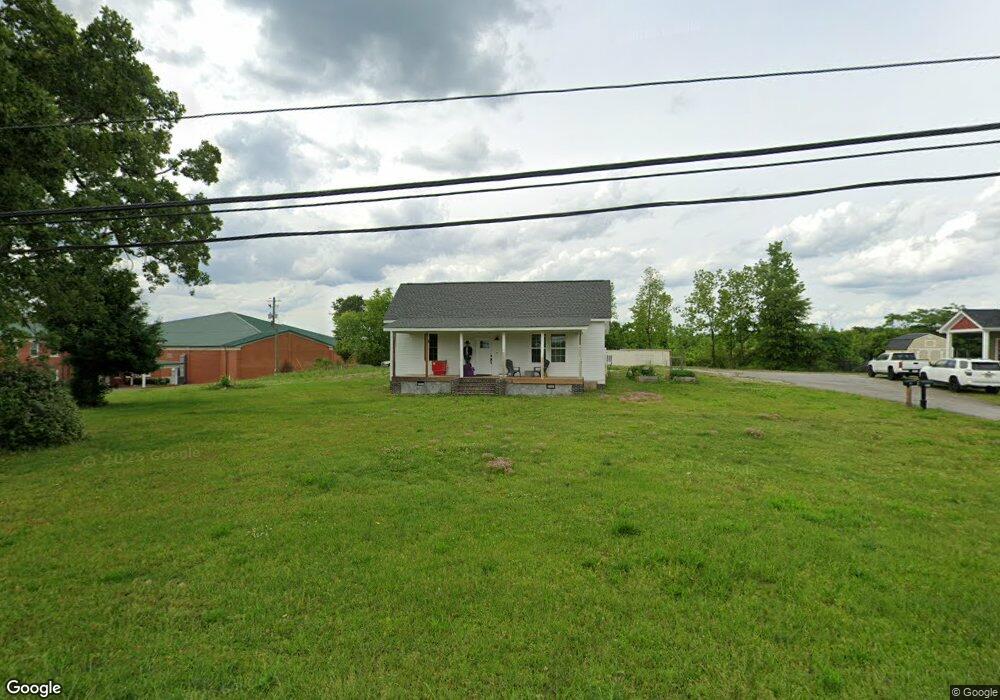
263 Lagrange St Newnan, GA 30263
Estimated Value: $205,000 - $268,000
2
Beds
1
Bath
1,784
Sq Ft
$132/Sq Ft
Est. Value
About This Home
This home is located at 263 Lagrange St, Newnan, GA 30263 and is currently estimated at $235,640, approximately $132 per square foot. 263 Lagrange St is a home located in Coweta County with nearby schools including Ruth Hill Elementary School, Smokey Road Middle School, and Newnan High School.
Ownership History
Date
Name
Owned For
Owner Type
Purchase Details
Closed on
Nov 2, 2016
Sold by
James W Estate
Bought by
Blalock Stephen Maurice
Current Estimated Value
Home Financials for this Owner
Home Financials are based on the most recent Mortgage that was taken out on this home.
Original Mortgage
$61,200
Outstanding Balance
$38,967
Interest Rate
3.42%
Mortgage Type
New Conventional
Estimated Equity
$196,673
Purchase Details
Closed on
Jun 9, 2005
Sold by
Sumner Camilla
Bought by
Sumner Clarence D
Purchase Details
Closed on
Dec 30, 2002
Sold by
Hutchens Sumner Camilla
Bought by
Hutchens Sumner Camilla
Purchase Details
Closed on
Mar 17, 2000
Sold by
Davis Virginia H Mrs
Bought by
Hutchens Sumner Camilla
Purchase Details
Closed on
Jun 10, 1994
Bought by
Davis Virginia H Mrs
Create a Home Valuation Report for This Property
The Home Valuation Report is an in-depth analysis detailing your home's value as well as a comparison with similar homes in the area
Purchase History
| Date | Buyer | Sale Price | Title Company |
|---|---|---|---|
| Blalock Stephen Maurice | -- | -- | |
| Blalock Stephen M | $76,500 | -- | |
| Sumner Clarence D | -- | -- | |
| Hutchens Sumner Camilla | -- | -- | |
| Hutchens Sumner Camilla | -- | -- | |
| Davis Virginia H Mrs | -- | -- |
Source: Public Records
Mortgage History
| Date | Status | Borrower | Loan Amount |
|---|---|---|---|
| Open | Blalock Stephen M | $61,200 | |
| Closed | Blalock Stephen Maurice | $61,200 |
Source: Public Records
Tax History
| Year | Tax Paid | Tax Assessment Tax Assessment Total Assessment is a certain percentage of the fair market value that is determined by local assessors to be the total taxable value of land and additions on the property. | Land | Improvement |
|---|---|---|---|---|
| 2025 | $1,805 | $76,416 | $19,312 | $57,104 |
| 2024 | $1,745 | $75,173 | $19,312 | $55,861 |
| 2023 | $1,745 | $77,753 | $19,312 | $58,441 |
Source: Public Records
Map
Nearby Homes
- 0 Smokey Rd Unit 10495165
- 89 Bailey Dr
- 19 Festiva Dr
- 218 Arlington Ct
- 69 Bailey Dr
- 9 Meridian Dr
- 25 Bailey Dr
- LOT 2-0 Belk Rd
- 12 Smokey Ridge Ct
- 12 Conner Dr
- 13 Midland Park Way
- 37 Westgate Park Ln
- 100 Lovelace St
- 150 Teal Place
- 25 Westgate Park Dr
- 8 Westgate Park Ct
- 26 Boone Dr
- 17 Westgate Park Dr
- 66 Westside School Rd
- 9 Union St
- 261 Lagrange St
- 259 Lagrange St
- 266 Lagrange St
- 257 Lagrange St
- 24 Woodrow Place
- 264 Lagrange St
- 300 Smokey Rd
- 32 Woodrow Place
- 4 Sweetbriar Rd
- 5 Pinelea Dr
- 258 Lagrange St
- 318 Smokey Rd
- 40 Woodrow Place
- 327 Smokey Rd
- 7 Pinelea Dr
- 6 Sweetbriar Rd
- 256 Lagrange St
- 5 Sweetbriar Rd
- 253 Lagrange St
- 21 Woodrow Place
Your Personal Tour Guide
Ask me questions while you tour the home.