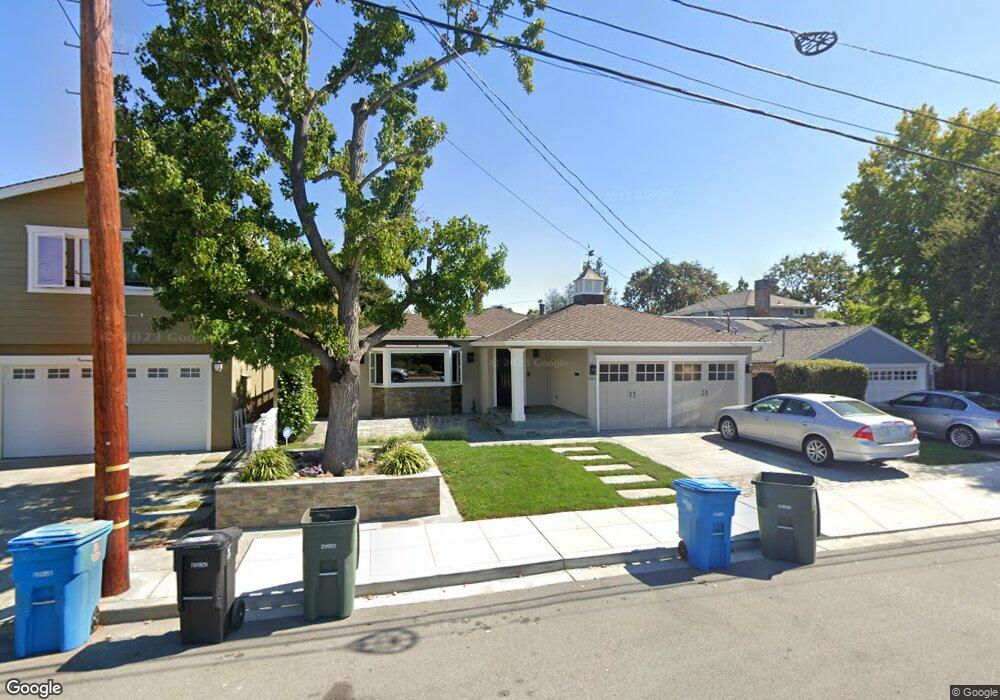
263 Ruby Ave San Carlos, CA 94070
El Sereno Corte NeighborhoodEstimated Value: $2,148,150 - $2,372,000
2
Beds
1
Bath
1,490
Sq Ft
$1,502/Sq Ft
Est. Value
About This Home
This home is located at 263 Ruby Ave, San Carlos, CA 94070 and is currently estimated at $2,238,538, approximately $1,502 per square foot. 263 Ruby Ave is a home located in San Mateo County with nearby schools including White Oaks Elementary School, Central Middle School, and Sequoia High School.
Ownership History
Date
Name
Owned For
Owner Type
Purchase Details
Closed on
Jun 11, 2015
Sold by
Donnell Harry F O
Bought by
Donnell Harry F O
Current Estimated Value
Purchase Details
Closed on
Mar 24, 2015
Sold by
Quiroz Leslie B
Bought by
Donnell Harry F O
Home Financials for this Owner
Home Financials are based on the most recent Mortgage that was taken out on this home.
Original Mortgage
$160,000
Interest Rate
3.54%
Mortgage Type
New Conventional
Purchase Details
Closed on
Mar 12, 2015
Sold by
Donnell Harry F O
Bought by
Donnell Harry F O and Quiroz Leslie B
Home Financials for this Owner
Home Financials are based on the most recent Mortgage that was taken out on this home.
Original Mortgage
$160,000
Interest Rate
3.54%
Mortgage Type
New Conventional
Create a Home Valuation Report for This Property
The Home Valuation Report is an in-depth analysis detailing your home's value as well as a comparison with similar homes in the area
Home Values in the Area
Average Home Value in this Area
Purchase History
| Date | Buyer | Sale Price | Title Company |
|---|---|---|---|
| Donnell Harry F O | -- | None Available | |
| Donnell Harry F O | -- | None Available | |
| Donnell Harry F O | -- | Fidelity Natl Title Ins Co |
Source: Public Records
Mortgage History
| Date | Status | Borrower | Loan Amount |
|---|---|---|---|
| Closed | Donnell Harry F O | $160,000 |
Source: Public Records
Tax History
| Year | Tax Paid | Tax Assessment Tax Assessment Total Assessment is a certain percentage of the fair market value that is determined by local assessors to be the total taxable value of land and additions on the property. | Land | Improvement |
|---|---|---|---|---|
| 2025 | $7,690 | $535,921 | $172,252 | $363,669 |
| 2023 | $7,690 | $515,113 | $165,564 | $349,549 |
| 2022 | $7,270 | $505,014 | $162,318 | $342,696 |
| 2021 | $7,147 | $495,113 | $159,136 | $335,977 |
| 2020 | $7,046 | $490,037 | $157,505 | $332,532 |
| 2019 | $6,859 | $480,429 | $154,417 | $326,012 |
| 2018 | $6,671 | $471,010 | $151,390 | $319,620 |
| 2017 | $6,563 | $461,775 | $148,422 | $313,353 |
| 2016 | $6,405 | $452,721 | $145,512 | $307,209 |
| 2015 | $6,384 | $445,922 | $143,327 | $302,595 |
| 2014 | $6,135 | $437,188 | $140,520 | $296,668 |
Source: Public Records
Map
Nearby Homes
- 2349 Eaton Ave
- 2044 Saint Francis Way
- 2638 Eaton Ave
- 1235 Edgewood Rd
- 921 Arlington Rd
- 27 Nevada St
- 16 Hillview Ave
- 41 Maple Way
- 1353 Edgewood Rd
- 1365 Edgewood Rd
- 40 Robin Way
- 419 Hill Way
- 2308 Howard Ave
- 6 El Sereno Dr
- 1928 Howard Ave
- 2780 Bromley Dr
- 2910 Sherwood Dr
- 0 Cobblestone Ln
- 314 Outer Cir
- 38 Liberty Hall Ln
Your Personal Tour Guide
Ask me questions while you tour the home.