
Seller's Agent in 2025
Edith Wallace
Maximum One Realtor Partners
(404) 454-5485
2 in this area
11 Total Sales
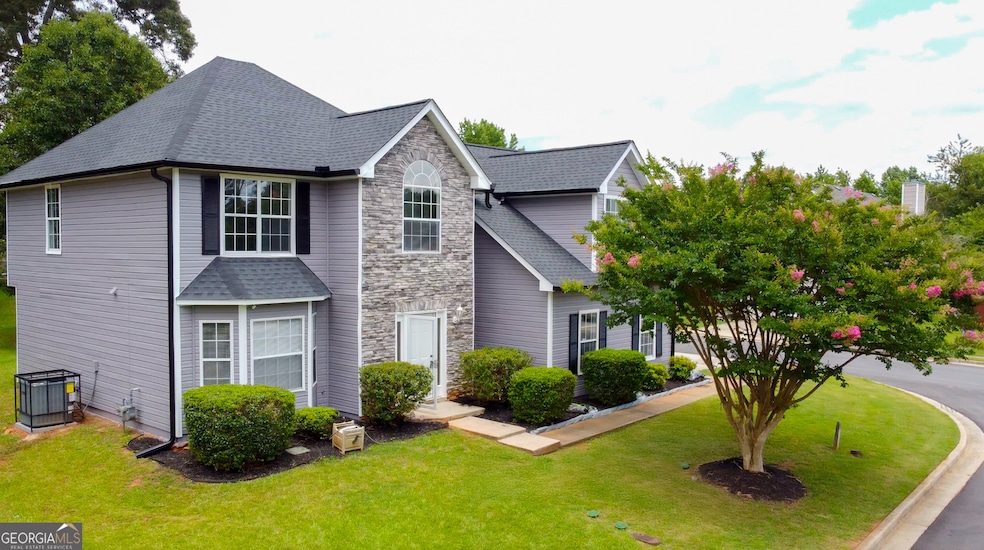
Welcome to Rambling Way! Your Dream Home - Where Style Meets Comfort! Step inside this beautifully remodeled 4 bedrooms, 2.5 baths home that seamlessly blends modern luxury with timeless charm. Nestled in a family oriented neighborhood, this turnkey residence boasts a spacious open-concept layout, perfect for both everyday living and entertaining. The heart of the home is the stunning custom paint job, new roof, new gutters, new heating & air system, granite countertops, stainless steel appliances, a generous island and a breakfast bar with seating-ideal for morning coffee or hosting friends and family. The newly installed luxury vinyl floors flow throughout the main living areas, enhancing the home's warmth and sophistication. Retreat to the luxurious primary suite, complete with a spa-inspired ensuite bathroom showcasing a walk-in shower, soaking tub, and granite vanity. The additional bedrooms are spacious with ample closet space. One of them extra large with 3 closets, and 2 storage areas. This beauty has been thoughtfully renovated to accommodate a growing family's needs. PRINCIPLE IS A LICENSED REAL ESTATE AGENT #324987. Deed will not be seasoned until 08/28/25.
Last Agent to Sell the Property
Maximum One Realtor Partners License #324987 Listed on: 07/03/2025
| Date | Type | Sale Price | Title Company |
|---|---|---|---|
| Warranty Deed | -- | -- | |
| Limited Warranty Deed | $297,000 | -- | |
| Deed | $99,900 | -- | |
| Deed | -- | -- | |
| Deed | -- | -- | |
| Deed | $125,000 | -- | |
| Quit Claim Deed | -- | -- | |
| Deed | -- | -- | |
| Foreclosure Deed | $154,195 | -- | |
| Deed | $144,400 | -- |
| Date | Status | Loan Amount | Loan Type |
|---|---|---|---|
| Previous Owner | $98,090 | FHA | |
| Previous Owner | $136,730 | No Value Available | |
| Previous Owner | $143,250 | FHA |
| Date | Event | Price | List to Sale | Price per Sq Ft |
|---|---|---|---|---|
| 08/14/2025 08/14/25 | Sold | $297,000 | +0.3% | $143 / Sq Ft |
| 07/14/2025 07/14/25 | Pending | -- | -- | -- |
| 07/03/2025 07/03/25 | For Sale | $296,000 | -- | $142 / Sq Ft |
| Year | Tax Paid | Tax Assessment Tax Assessment Total Assessment is a certain percentage of the fair market value that is determined by local assessors to be the total taxable value of land and additions on the property. | Land | Improvement |
|---|---|---|---|---|
| 2025 | $2,882 | $107,000 | $18,000 | $89,000 |
| 2024 | $2,801 | $101,720 | $18,000 | $83,720 |
| 2023 | $2,801 | $98,560 | $18,000 | $80,560 |
| 2022 | $2,329 | $85,560 | $8,000 | $77,560 |
| 2021 | $1,862 | $64,560 | $8,000 | $56,560 |
| 2020 | $1,609 | $54,080 | $8,000 | $46,080 |
| 2019 | $1,565 | $51,600 | $8,000 | $43,600 |
| 2018 | $1,340 | $49,200 | $8,000 | $41,200 |
| 2017 | $1,463 | $45,320 | $4,200 | $41,120 |
| 2016 | $1,354 | $42,040 | $4,200 | $37,840 |
| 2014 | $1,050 | $32,920 | $4,200 | $28,720 |
Seller's Agent in 2025
Edith Wallace
Maximum One Realtor Partners
(404) 454-5485
2 in this area
11 Total Sales
Buyer's Agent in 2025
Antanique Williams
Brownstone Realty Group LLC
(404) 423-0668
2 in this area
21 Total Sales
Source: Georgia MLS
MLS Number: 10558018
APN: 16-122-03-004
Disclaimer: Certain information contained herein is derived from information provided by parties other than Homes.com. All information provided is deemed reliable, but is not guaranteed to be accurate and should be independently verified.
![]() The data relating to real estate for sale on this web site comes in part from the Broker Reciprocity Program of Georgia MLS. Real estate listings held by brokerage firms other than Redfin are marked with the Broker Reciprocity logo and detailed information about them includes the name of the listing brokers. Information deemed reliable but not guaranteed. Copyright 2025 Georgia MLS. All rights reserved.
The data relating to real estate for sale on this web site comes in part from the Broker Reciprocity Program of Georgia MLS. Real estate listings held by brokerage firms other than Redfin are marked with the Broker Reciprocity logo and detailed information about them includes the name of the listing brokers. Information deemed reliable but not guaranteed. Copyright 2025 Georgia MLS. All rights reserved.