2631 Key St Jackson, MS 39212
South Jackson NeighborhoodEstimated Value: $44,000 - $55,491
3
Beds
2
Baths
1,093
Sq Ft
$45/Sq Ft
Est. Value
About This Home
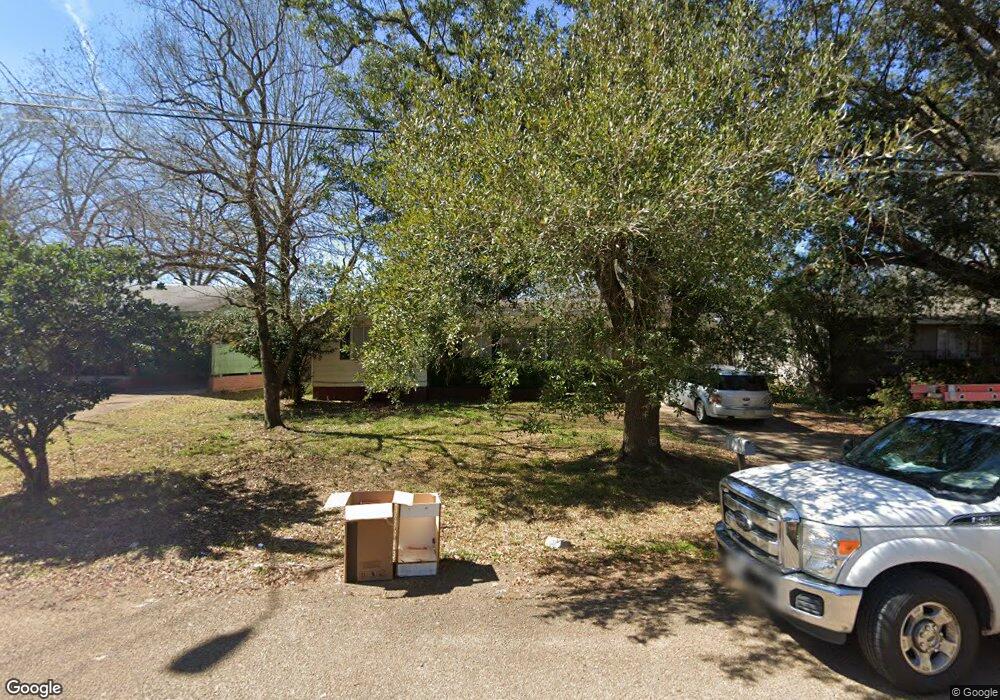
This home is located at 2631 Key St, Jackson, MS 39212 and is currently estimated at $49,623, approximately $45 per square foot. 2631 Key St is a home located in Hinds County with nearby schools including Key Elementary School, Peeples Middle School, and E.E. Rogers SDA School.
Ownership History
Date
Name
Owned For
Owner Type
Purchase Details
Closed on
Aug 27, 2018
Sold by
Community T
Bought by
Maddog Holdings Group Llc
Current Estimated Value
Purchase Details
Closed on
May 14, 2016
Sold by
Risorto Enterprises Llc
Bought by
Key Heights Homowner
Home Financials for this Owner
Home Financials are based on the most recent Mortgage that was taken out on this home.
Original Mortgage
$16,500
Interest Rate
3.58%
Mortgage Type
Purchase Money Mortgage
Purchase Details
Closed on
Jun 20, 2011
Sold by
Homestar Llc
Bought by
Risorto Enterprises Llc
Purchase Details
Closed on
Mar 25, 2011
Sold by
Shields Nicole
Bought by
Homestar Llc
Create a Home Valuation Report for This Property
The Home Valuation Report is an in-depth analysis detailing your home's value as well as a comparison with similar homes in the area
Home Values in the Area
Average Home Value in this Area
Purchase History
| Date | Buyer | Sale Price | Title Company |
|---|---|---|---|
| Maddog Holdings Group Llc | -- | -- | |
| Key Heights Homowner | -- | None Available | |
| Risorto Enterprises Llc | -- | -- | |
| Homestar Llc | -- | -- |
Source: Public Records
Mortgage History
| Date | Status | Borrower | Loan Amount |
|---|---|---|---|
| Previous Owner | Key Heights Homowner | $16,500 |
Source: Public Records
Tax History
| Year | Tax Paid | Tax Assessment Tax Assessment Total Assessment is a certain percentage of the fair market value that is determined by local assessors to be the total taxable value of land and additions on the property. | Land | Improvement |
|---|---|---|---|---|
| 2025 | $1,043 | $5,448 | $1,125 | $4,323 |
| 2024 | $1,043 | $5,396 | $1,125 | $4,271 |
| 2023 | $1,043 | $5,396 | $1,125 | $4,271 |
| 2022 | $1,038 | $5,396 | $1,125 | $4,271 |
| 2021 | $1,038 | $5,396 | $1,125 | $4,271 |
| 2020 | $1,024 | $5,355 | $1,125 | $4,230 |
| 2019 | $1,025 | $5,355 | $1,125 | $4,230 |
| 2018 | $1,014 | $5,355 | $1,125 | $4,230 |
| 2017 | $988 | $5,355 | $1,125 | $4,230 |
| 2016 | $988 | $5,355 | $1,125 | $4,230 |
| 2015 | $946 | $5,282 | $1,125 | $4,157 |
| 2014 | $944 | $5,282 | $1,125 | $4,157 |
Source: Public Records
Map
Nearby Homes
- 0 Coronet Place Unit lot 6
- 2930 Greenview Dr
- 2955 Greenview Dr
- 236 Cherry Hill Dr
- 2451 Coronet Place
- 2647 Glenn St
- 2712 Hillside Dr
- 2438 Paden St
- 720 Winn St
- 134 Cherry Hill Dr
- 2416 Paden St
- 229 Hilliyard Ct
- 2931 Barwood Dr
- 2823 Fairhill Dr
- 167 Treehaven Dr
- 116 Treehaven Dr
- 746 Dorgan St
- 841 Winn St
- 233 Colonial Dr
- 311 W Santa Clair St
Your Personal Tour Guide
Ask me questions while you tour the home.