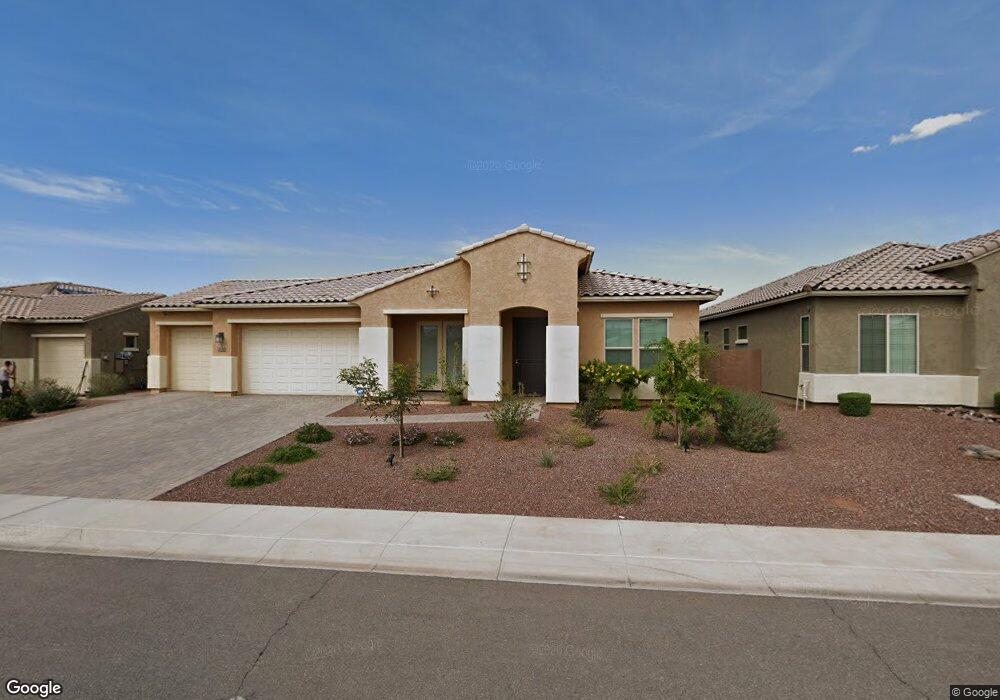
2632 W Rancho Laredo Dr Phoenix, AZ 85085
North Gateway NeighborhoodEstimated Value: $814,624 - $899,000
2
Beds
4
Baths
3,289
Sq Ft
$262/Sq Ft
Est. Value
About This Home
This home is located at 2632 W Rancho Laredo Dr, Phoenix, AZ 85085 and is currently estimated at $860,656, approximately $261 per square foot. 2632 W Rancho Laredo Dr is a home with nearby schools including Norterra Canyon School, Barry Goldwater High School, and Ridgeline Academy.
Ownership History
Date
Name
Owned For
Owner Type
Purchase Details
Closed on
Jul 24, 2020
Sold by
Urbatsch Brent Michael and Urbatsch Alexandra M
Bought by
Urbatsch Brent Michael and Urbatsch Alexandra M
Current Estimated Value
Home Financials for this Owner
Home Financials are based on the most recent Mortgage that was taken out on this home.
Original Mortgage
$393,960
Outstanding Balance
$349,986
Interest Rate
3.2%
Mortgage Type
VA
Estimated Equity
$510,670
Purchase Details
Closed on
Jun 10, 2017
Sold by
Urbatsch Brent Michael
Bought by
Urbatsch Brent Michael and Carlston Alexandra M
Purchase Details
Closed on
Mar 15, 2017
Sold by
Tm Homes Of Arizona Inc
Bought by
Urbatsch Brent Michael
Home Financials for this Owner
Home Financials are based on the most recent Mortgage that was taken out on this home.
Original Mortgage
$417,000
Interest Rate
4.19%
Mortgage Type
VA
Create a Home Valuation Report for This Property
The Home Valuation Report is an in-depth analysis detailing your home's value as well as a comparison with similar homes in the area
Home Values in the Area
Average Home Value in this Area
Purchase History
| Date | Buyer | Sale Price | Title Company |
|---|---|---|---|
| Urbatsch Brent Michael | -- | Title365 | |
| Urbatsch Brent Michael | -- | None Available | |
| Urbatsch Brent Michael | $445,628 | First American Title Ins Co | |
| Tm Homes Of Arizona Inc | -- | First American Title Ins Co |
Source: Public Records
Mortgage History
| Date | Status | Borrower | Loan Amount |
|---|---|---|---|
| Open | Urbatsch Brent Michael | $393,960 | |
| Closed | Urbatsch Brent Michael | $417,000 |
Source: Public Records
Tax History Compared to Growth
Tax History
| Year | Tax Paid | Tax Assessment Tax Assessment Total Assessment is a certain percentage of the fair market value that is determined by local assessors to be the total taxable value of land and additions on the property. | Land | Improvement |
|---|---|---|---|---|
| 2025 | $3,767 | $43,139 | -- | -- |
| 2024 | $3,698 | $41,085 | -- | -- |
| 2023 | $3,698 | $65,470 | $13,090 | $52,380 |
| 2022 | $3,553 | $45,000 | $9,000 | $36,000 |
| 2021 | $3,671 | $43,810 | $8,760 | $35,050 |
| 2020 | $3,604 | $42,900 | $8,580 | $34,320 |
| 2019 | $3,493 | $42,220 | $8,440 | $33,780 |
| 2018 | $3,372 | $13,350 | $13,350 | $0 |
| 2017 | $300 | $5,235 | $5,235 | $0 |
| 2016 | $284 | $3,690 | $3,690 | $0 |
| 2015 | $272 | $2,960 | $2,960 | $0 |
Source: Public Records
Map
Nearby Homes
- 2630 W Moura Dr
- 30609 N 25th Dr
- 2605 W Desert Marigold Dr
- 31324 N 26th Glen
- 2337 W Gloria Ln
- 2350 W Gloria Ln
- 2342 W Gloria Ln
- 2363 W Whisper Rock Trail
- 2371 W Whisper Rock Trail
- 31653 N 24th Dr
- 2121 W Sonoran Desert Dr Unit 65
- 2121 W Sonoran Desert Dr Unit 3
- 2121 W Sonoran Desert Dr Unit 114
- 2121 W Sonoran Desert Dr Unit 129
- 2121 W Sonoran Desert Dr Unit 59
- 2121 W Sonoran Desert Dr Unit 113
- 2121 W Sonoran Desert Dr
- 2121 W Sonoran Desert Dr Unit 107
- 2121 W Sonoran Desert Dr Unit 72
- 2121 W Sonoran Desert Dr Unit 70
- 2636 W Rancho Laredo Dr
- 2628 W Rancho Laredo Dr
- 2640 W Rancho Laredo Dr
- 2637 W Corva Dr
- 2624 W Rancho Laredo Dr
- 2627 W Rancho Laredo Dr
- 2631 W Rancho Laredo Dr
- 2641 W Corva Dr
- 2635 W Rancho Laredo Dr
- 2644 W Rancho Laredo Dr
- 2639 W Rancho Laredo Dr
- 2623 W Rancho Laredo Dr
- 2645 W Corva Dr
- 30905 N 27th Ave
- 2643 W Rancho Laredo Dr
- 2619 W Rancho Laredo Dr
- 2634 W Moura Dr
- 2615 W Rancho Laredo Dr
- 2626 W Moura Dr
- 2638 W Moura Dr