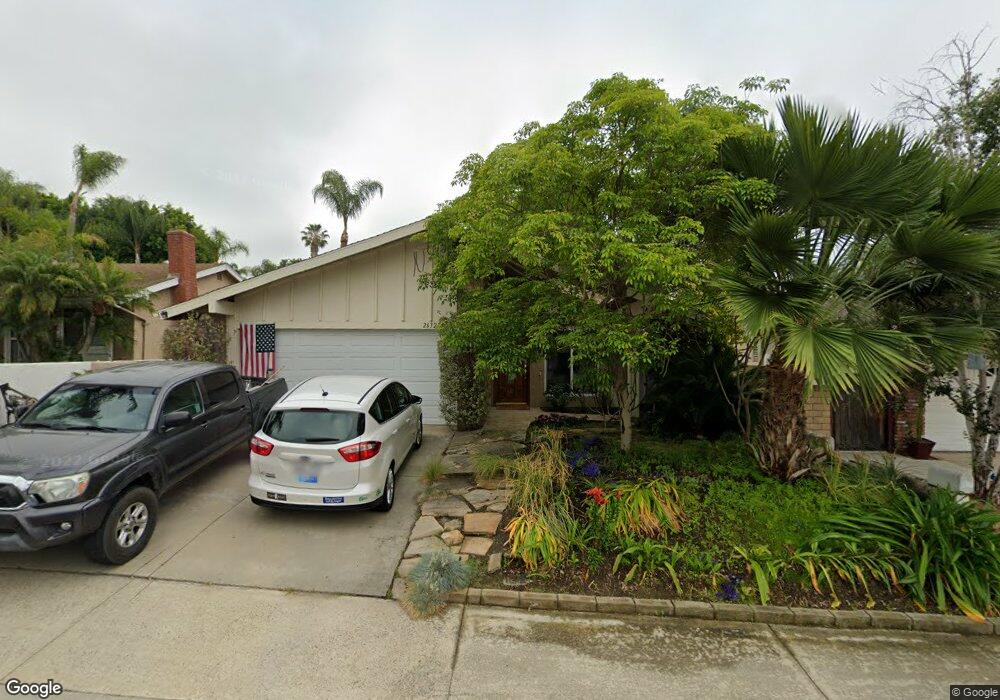
26322 Via Logrono Mission Viejo, CA 92691
Estimated Value: $1,028,000 - $1,128,000
3
Beds
2
Baths
1,382
Sq Ft
$788/Sq Ft
Est. Value
About This Home
This home is located at 26322 Via Logrono, Mission Viejo, CA 92691 and is currently estimated at $1,089,127, approximately $788 per square foot. 26322 Via Logrono is a home located in Orange County with nearby schools including Glen Yermo Elementary School, Los Alisos Intermediate School, and Mission Viejo High School.
Ownership History
Date
Name
Owned For
Owner Type
Purchase Details
Closed on
Oct 12, 2020
Sold by
Simpson Joseph W and Mcconnell Lisa C
Bought by
Mcconnell Lisa Colbert and Simpson Joseph William
Current Estimated Value
Purchase Details
Closed on
Jul 15, 2009
Sold by
Biagtan Rhoderick and Biagtan Jane
Bought by
Simpson Joseph W and Mcconnell Lisa C
Home Financials for this Owner
Home Financials are based on the most recent Mortgage that was taken out on this home.
Original Mortgage
$407,483
Interest Rate
4.87%
Mortgage Type
FHA
Purchase Details
Closed on
Mar 18, 2004
Sold by
Harris Ronald
Bought by
Gallup Harris Barbara Ann
Home Financials for this Owner
Home Financials are based on the most recent Mortgage that was taken out on this home.
Original Mortgage
$440,000
Interest Rate
5.12%
Mortgage Type
Stand Alone First
Create a Home Valuation Report for This Property
The Home Valuation Report is an in-depth analysis detailing your home's value as well as a comparison with similar homes in the area
Home Values in the Area
Average Home Value in this Area
Purchase History
| Date | Buyer | Sale Price | Title Company |
|---|---|---|---|
| Mcconnell Lisa Colbert | -- | None Available | |
| Simpson Joseph W | $415,000 | Calcounties Title Nation | |
| Gallup Harris Barbara Ann | -- | Southland Title Corporation | |
| Biagtan Rhoderick | $550,000 | Southland Title Corporation |
Source: Public Records
Mortgage History
| Date | Status | Borrower | Loan Amount |
|---|---|---|---|
| Previous Owner | Simpson Joseph W | $407,483 | |
| Previous Owner | Biagtan Rhoderick | $440,000 | |
| Closed | Biagtan Rhoderick | $110,000 |
Source: Public Records
Tax History Compared to Growth
Tax History
| Year | Tax Paid | Tax Assessment Tax Assessment Total Assessment is a certain percentage of the fair market value that is determined by local assessors to be the total taxable value of land and additions on the property. | Land | Improvement |
|---|---|---|---|---|
| 2025 | $5,348 | $535,683 | $423,138 | $112,545 |
| 2024 | $5,348 | $525,180 | $414,841 | $110,339 |
| 2023 | $5,221 | $514,883 | $406,707 | $108,176 |
| 2022 | $5,126 | $504,788 | $398,733 | $106,055 |
| 2021 | $5,023 | $494,891 | $390,915 | $103,976 |
| 2020 | $4,978 | $489,817 | $386,907 | $102,910 |
| 2019 | $4,877 | $480,213 | $379,320 | $100,893 |
| 2018 | $4,785 | $470,798 | $371,883 | $98,915 |
| 2017 | $4,688 | $461,567 | $364,591 | $96,976 |
| 2016 | $4,609 | $452,517 | $357,442 | $95,075 |
| 2015 | $4,553 | $445,720 | $352,073 | $93,647 |
| 2014 | $4,453 | $436,989 | $345,176 | $91,813 |
Source: Public Records
Map
Nearby Homes
- 23641 Coronel Dr
- 26302 Los Viveros Unit 152
- 26166 Los Viveros Unit 222
- 26212 La Real Unit D
- 23401 Via Linda Unit C
- 26205 La Real Unit E
- 23371 #E 290 Lacrescenta
- 23355 Via Linda Unit 3
- 23201 Via Mirlo
- 23301 La Crescenta
- 26702 Via Linares
- 24102 Castilla Ln
- 22922 Vía Nuez
- 26812 Via Llano
- 26328 Via Roble Unit 28
- 26368 Via Roble Unit 24
- 26253 Via Roble Unit 14
- 26068 Via Pera
- 23372 Via Bahia
- 26158 Via Pera Unit E4
- 26312 Via Logrono
- 26332 Via Logrono
- 26342 Via Logrono
- 26292 Via Logrono
- 26352 Via Logrono
- 26321 Via Logrono
- 26331 Via Logrono
- 26311 Via Logrono
- 26282 Via Logrono
- 26341 Via Logrono
- 26301 Via Logrono
- 26356 Via Logrono
- 26341 Alhondra Place
- 26272 Via Logrono
- 26291 Via Logrono
- 26351 Alhondra Place
- 26351 Via Logrono
- 26362 Via Logrono
- 23602 Coronel Dr
- 26361 Alhondra Place