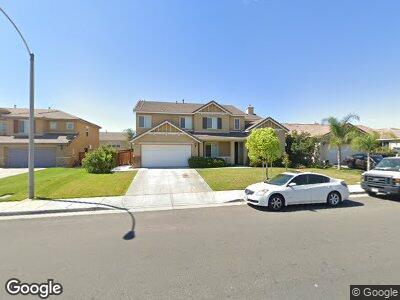
26335 Field St Moreno Valley, CA 92555
Rancho Belago NeighborhoodEstimated Value: $618,865 - $655,000
3
Beds
3
Baths
2,520
Sq Ft
$255/Sq Ft
Est. Value
About This Home
This home is located at 26335 Field St, Moreno Valley, CA 92555 and is currently estimated at $642,716, approximately $255 per square foot. 26335 Field St is a home located in Riverside County with nearby schools including Moreno Elementary School, Mountain View Middle, and Valley View High School.
Ownership History
Date
Name
Owned For
Owner Type
Purchase Details
Closed on
Feb 18, 2009
Sold by
Lasalle Bank National Association
Bought by
Garibay Erika and Garibay Alex
Current Estimated Value
Home Financials for this Owner
Home Financials are based on the most recent Mortgage that was taken out on this home.
Original Mortgage
$213,069
Interest Rate
5.17%
Mortgage Type
FHA
Purchase Details
Closed on
Nov 10, 2008
Sold by
Rangel Leticia Luz and Suarez Mario
Bought by
Lasalle Bank National Association
Purchase Details
Closed on
Aug 20, 2005
Sold by
Western Pacific Housing Inc
Bought by
Rangel Leticia Luz and Suarez Mario
Home Financials for this Owner
Home Financials are based on the most recent Mortgage that was taken out on this home.
Original Mortgage
$331,294
Interest Rate
6.75%
Mortgage Type
Stand Alone First
Create a Home Valuation Report for This Property
The Home Valuation Report is an in-depth analysis detailing your home's value as well as a comparison with similar homes in the area
Home Values in the Area
Average Home Value in this Area
Purchase History
| Date | Buyer | Sale Price | Title Company |
|---|---|---|---|
| Garibay Erika | $217,000 | Chicago Title Irvine | |
| Lasalle Bank National Association | $182,587 | None Available | |
| Rangel Leticia Luz | $368,500 | Chicago Title |
Source: Public Records
Mortgage History
| Date | Status | Borrower | Loan Amount |
|---|---|---|---|
| Open | Garibay Erika | $167,109 | |
| Closed | Garibay Erika | $186,971 | |
| Closed | Garibay Erika | $12,603 | |
| Previous Owner | Garibay Erika | $213,069 | |
| Previous Owner | Rangel Leticia Luz | $60,000 | |
| Previous Owner | Rangel Leticia Luz | $331,294 |
Source: Public Records
Tax History Compared to Growth
Tax History
| Year | Tax Paid | Tax Assessment Tax Assessment Total Assessment is a certain percentage of the fair market value that is determined by local assessors to be the total taxable value of land and additions on the property. | Land | Improvement |
|---|---|---|---|---|
| 2023 | $6,776 | $268,574 | $55,687 | $212,887 |
| 2022 | $10,572 | $263,309 | $54,596 | $208,713 |
| 2021 | $10,398 | $258,147 | $53,526 | $204,621 |
| 2020 | $10,214 | $255,501 | $52,978 | $202,523 |
| 2019 | $10,112 | $250,492 | $51,940 | $198,552 |
| 2018 | $10,155 | $245,581 | $50,923 | $194,658 |
| 2017 | $10,017 | $240,767 | $49,925 | $190,842 |
| 2016 | $9,922 | $236,047 | $48,947 | $187,100 |
| 2015 | $5,702 | $232,504 | $48,213 | $184,291 |
| 2014 | $5,464 | $227,951 | $47,269 | $180,682 |
Source: Public Records
Map
Nearby Homes
- 13638 Regis Dr
- 13604 Darwin Dr
- 26124 Windemere Way
- 13867 Azure St
- 13788 Westwind Ln
- 13891 Azure St
- 13906 Azure St
- 13876 Vantage St
- 13903 Azure St
- 13894 Azure St
- 13882 Azure St
- 13927 Azure St
- 13557 Collie Ct
- 13677 Balsawood Ln
- 1873 Makenna St
- 1883 Makenna St
- 26603 Sage Brush Ct
- 26606 Danube Way
- 14147 Darwin Dr
- 26670 Opal St
- 26335 Field St
- 26347 Field St
- 26323 Field St
- 26338 Bay Ave
- 26348 Bay Ave
- 26350 Bay Ave
- 26326 Bay Ave
- 26359 Field St
- 13663 Sydney Ave
- 26362 Bay Ave
- 26371 Field St
- 13656 Darwin Dr
- 0 Darwin Unit IV14096521
- 13651 Sydney Ave
- 13693 Darwin Dr
- 26374 Bay Ave
- 13681 Darwin Dr
- 13705 Darwin Dr
- 13669 Darwin Dr
- 26337 Bay Ave