Estimated Value: $735,000 - $929,000
4
Beds
3
Baths
1,997
Sq Ft
$409/Sq Ft
Est. Value
About This Home
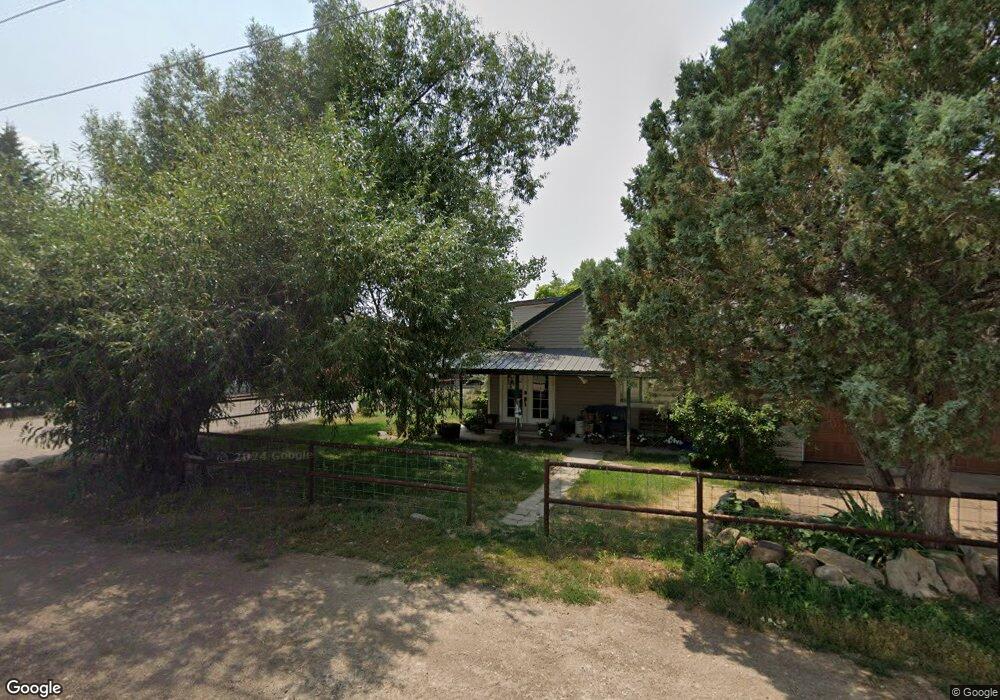
This home is located at 2634 Willow Way, Kamas, UT 84036 and is currently estimated at $816,372, approximately $408 per square foot. 2634 Willow Way is a home located in Summit County with nearby schools including South Summit Elementary School and South Summit High School.
Ownership History
Date
Name
Owned For
Owner Type
Purchase Details
Closed on
Mar 27, 2015
Sold by
Harris Rusty and Harris Britni
Bought by
Lilly Joshua S and Lilly Kayci L
Current Estimated Value
Home Financials for this Owner
Home Financials are based on the most recent Mortgage that was taken out on this home.
Original Mortgage
$268,367
Outstanding Balance
$203,499
Interest Rate
3.65%
Mortgage Type
New Conventional
Estimated Equity
$612,873
Purchase Details
Closed on
Jan 11, 2013
Sold by
Harris Rusty C and Harris Britni W
Bought by
Harris Rusty and Harris Britni
Purchase Details
Closed on
Mar 21, 2006
Sold by
Harris Rusty C and Harris Britini W
Bought by
Harris Rusty C and Harris Britni W
Home Financials for this Owner
Home Financials are based on the most recent Mortgage that was taken out on this home.
Original Mortgage
$25,000
Interest Rate
6.25%
Mortgage Type
Credit Line Revolving
Purchase Details
Closed on
Aug 2, 2005
Sold by
Woodard John Lew
Bought by
Harris Rusty C and Harris Britni W
Create a Home Valuation Report for This Property
The Home Valuation Report is an in-depth analysis detailing your home's value as well as a comparison with similar homes in the area
Home Values in the Area
Average Home Value in this Area
Purchase History
We collect this data history from publicly available records. To have your information removed, we recommend requesting removal directly through your county’s website.
| Date | Buyer | Sale Price | Title Company |
|---|---|---|---|
| Lilly Joshua S | -- | Founders Title Company | |
| Harris Rusty | -- | Cornerstone Title Ins Ag | |
| Harris Rusty C | -- | First American Title Insuran | |
| Harris Rusty C | -- | None Available |
Source: Public Records
Mortgage History
We collect this data history from publicly available records. To have your information removed, we recommend requesting removal directly through your county’s website.
| Date | Status | Borrower | Loan Amount |
|---|---|---|---|
| Open | Lilly Joshua S | $268,367 | |
| Previous Owner | Harris Rusty C | $25,000 | |
| Previous Owner | Harris Rusty C | $216,000 |
Source: Public Records
Tax History
| Year | Tax Paid | Tax Assessment Tax Assessment Total Assessment is a certain percentage of the fair market value that is determined by local assessors to be the total taxable value of land and additions on the property. | Land | Improvement |
|---|---|---|---|---|
| 2025 | $2,441 | $386,279 | $103,400 | $282,879 |
| 2024 | $2,365 | $383,673 | $93,500 | $290,173 |
| 2023 | $2,365 | $383,673 | $93,500 | $290,173 |
| 2022 | $2,120 | $303,415 | $66,000 | $237,415 |
| 2021 | $1,772 | $197,815 | $31,625 | $166,190 |
| 2020 | $1,545 | $168,798 | $31,625 | $137,173 |
| 2019 | $1,563 | $152,970 | $31,625 | $121,345 |
| 2018 | $1,312 | $133,455 | $25,300 | $108,155 |
| 2017 | $1,235 | $128,180 | $25,300 | $102,880 |
| 2016 | $1,123 | $109,714 | $25,300 | $84,414 |
| 2015 | $1,088 | $103,905 | $0 | $0 |
| 2013 | $1,172 | $103,905 | $0 | $0 |
Source: Public Records
Map
Nearby Homes
- 2977 Willow Way
- 798 Lazy Way Unit 11
- 798 Lazy Way
- 1600 High Country Ln Unit 62
- 740 Lazy Way
- 740 Lazy Way Unit 10
- 1538 Stewart Lane Lot: 3
- 850 Lazy Way Unit 8
- 850 Lazy Way
- 1431 Rocky Mountain Way Unit 206
- 1431 Rocky Mountain Way
- 1465 Rocky Mountain Way Unit 204
- 1465 Rocky Mountain Way
- 3044 Clover Ct
- 1537 Stewart Lane Lot: 4
- 3068 Clover Ct
- 1429 Electric Ave
- 3043 Clover Ct
- 3043 Clover Ct Unit 313
- 3063 Clover Ct
- 2632 Willow Way
- 2628 Willow Way
- 2610 Willow Way
- 2362 Willow Way
- 2612 Willow Way
- 2608 Willow Way
- 2654 Willow Way
- 2652 Willow Way
- 2616 Willow Way
- 2578 Willow Way
- 2680 Willow Way
- 2630 Willow Way
- 2618 S 1000 E
- 2659 Willow Way
- 2682 Willow Way
- 2571 Willow Way
- 2548 Willow Way
- 2650 Willow Way
- 2551 Willow Way
- 2715 Willow Way
Your Personal Tour Guide
Ask me questions while you tour the home.