2635 N 400 W Bluffton, IN 46714
Estimated Value: $243,000 - $487,000
2
Beds
2
Baths
1,674
Sq Ft
$226/Sq Ft
Est. Value
About This Home
This home is located at 2635 N 400 W, Bluffton, IN 46714 and is currently estimated at $377,810, approximately $225 per square foot. 2635 N 400 W is a home located in Wells County with nearby schools including Norwell High School.
Ownership History
Date
Name
Owned For
Owner Type
Purchase Details
Closed on
Aug 18, 2021
Sold by
Neill Stephanie A
Bought by
Neill Stephanie A
Current Estimated Value
Create a Home Valuation Report for This Property
The Home Valuation Report is an in-depth analysis detailing your home's value as well as a comparison with similar homes in the area
Home Values in the Area
Average Home Value in this Area
Purchase History
| Date | Buyer | Sale Price | Title Company |
|---|---|---|---|
| Neill Stephanie A | -- | None Available |
Source: Public Records
Tax History Compared to Growth
Tax History
| Year | Tax Paid | Tax Assessment Tax Assessment Total Assessment is a certain percentage of the fair market value that is determined by local assessors to be the total taxable value of land and additions on the property. | Land | Improvement |
|---|---|---|---|---|
| 2024 | $2,815 | $396,900 | $109,500 | $287,400 |
| 2023 | $2,666 | $378,000 | $109,500 | $268,500 |
| 2022 | $2,013 | $300,800 | $60,000 | $240,800 |
| 2021 | $1,035 | $167,000 | $60,000 | $107,000 |
| 2020 | $578 | $137,000 | $22,800 | $114,200 |
| 2019 | $604 | $137,100 | $17,100 | $120,000 |
| 2018 | $583 | $134,800 | $16,800 | $118,000 |
| 2017 | $464 | $132,200 | $15,800 | $116,400 |
| 2016 | $426 | $123,400 | $14,900 | $108,500 |
| 2014 | $346 | $114,800 | $13,400 | $101,400 |
| 2013 | $319 | $114,900 | $13,400 | $101,500 |
Source: Public Records
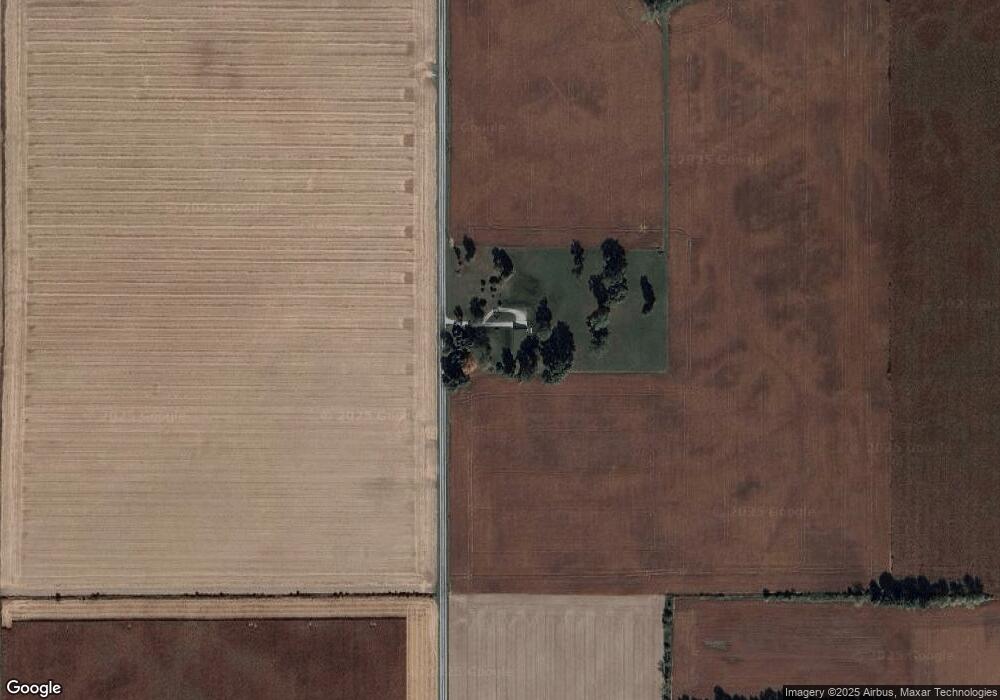
Map
Nearby Homes
- 3869 Indiana 116
- 4255 NW State Road 116-90
- 3680 W 550 N
- 310 Cottonwood Ct
- 451 Cottonwood Ct
- 4906 N 100 W
- 5798 N 200 W
- TBD N 200 W
- 5909 N Lincoln St
- 5928 Miller St
- 5970 N Main St
- 5964 N Miller
- TBD N 100 W Unit 2
- TBD N 100 W
- TBD N 200 W
- 2454 S 300 E
- 798 N 500 E
- 716 E 550 N
- TBD N Fairway Ln
- 609 W 200 S