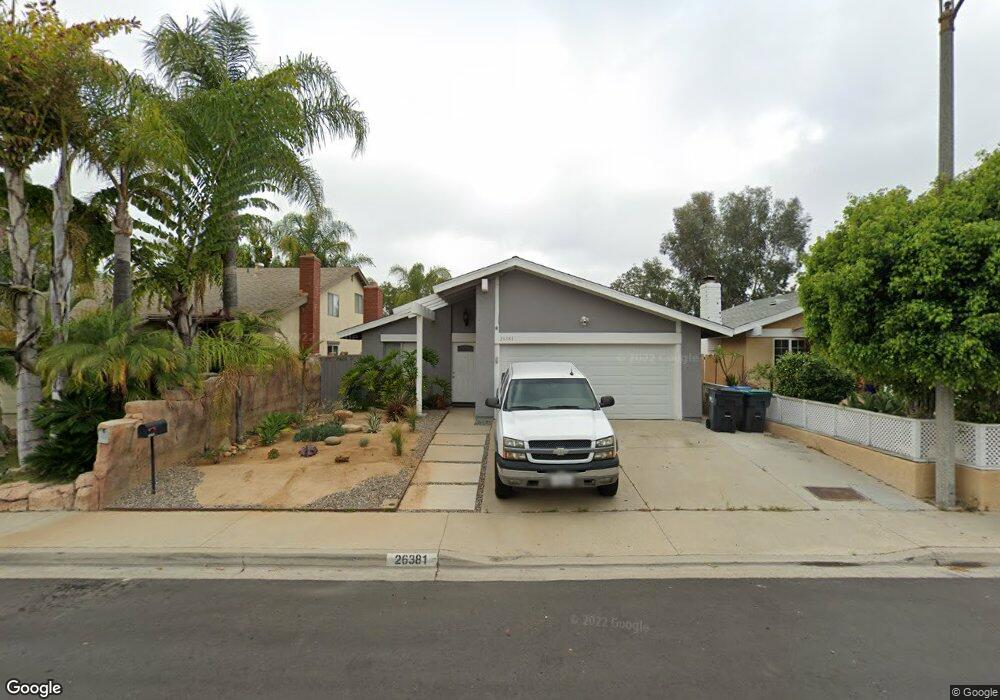
26381 Via Logrono Mission Viejo, CA 92691
Estimated Value: $854,000 - $1,060,108
3
Beds
2
Baths
1,178
Sq Ft
$832/Sq Ft
Est. Value
About This Home
This home is located at 26381 Via Logrono, Mission Viejo, CA 92691 and is currently estimated at $980,527, approximately $832 per square foot. 26381 Via Logrono is a home located in Orange County with nearby schools including Glen Yermo Elementary School, Los Alisos Intermediate School, and Mission Viejo High School.
Ownership History
Date
Name
Owned For
Owner Type
Purchase Details
Closed on
Mar 12, 2021
Sold by
Schwartz Delmar K and Schwartz Suzanne M
Bought by
Washlake Chad Lee
Current Estimated Value
Home Financials for this Owner
Home Financials are based on the most recent Mortgage that was taken out on this home.
Original Mortgage
$320,000
Outstanding Balance
$286,857
Interest Rate
2.7%
Mortgage Type
New Conventional
Estimated Equity
$693,670
Purchase Details
Closed on
Jul 11, 2016
Sold by
Schwartz Delmark K and Schwartz Suzanne M
Bought by
Schwartz Delmar K and Schwartz Suzanne M
Purchase Details
Closed on
Oct 1, 1995
Sold by
Schwartz Del K and Schwartz Delmar K
Bought by
Schwartz Delmar K and Del Schwartz Separate Property Trust
Purchase Details
Closed on
Mar 7, 1994
Sold by
Schwartz Kathleen M
Bought by
Schwartz Delmar K
Create a Home Valuation Report for This Property
The Home Valuation Report is an in-depth analysis detailing your home's value as well as a comparison with similar homes in the area
Home Values in the Area
Average Home Value in this Area
Purchase History
| Date | Buyer | Sale Price | Title Company |
|---|---|---|---|
| Washlake Chad Lee | $350,000 | Wfg Title Company Of Ca | |
| Schwartz Delmar K | -- | None Available | |
| Schwartz Delmar K | -- | None Available | |
| Schwartz Delmar K | -- | -- | |
| Schwartz Delmar K | -- | Continental Lawyers Title Co |
Source: Public Records
Mortgage History
| Date | Status | Borrower | Loan Amount |
|---|---|---|---|
| Open | Washlake Chad Lee | $320,000 |
Source: Public Records
Tax History Compared to Growth
Tax History
| Year | Tax Paid | Tax Assessment Tax Assessment Total Assessment is a certain percentage of the fair market value that is determined by local assessors to be the total taxable value of land and additions on the property. | Land | Improvement |
|---|---|---|---|---|
| 2025 | $7,586 | $757,701 | $675,334 | $82,367 |
| 2024 | $7,586 | $742,845 | $662,093 | $80,752 |
| 2023 | $7,406 | $728,280 | $649,111 | $79,169 |
| 2022 | $7,272 | $714,000 | $636,383 | $77,617 |
| 2021 | $1,808 | $174,353 | $97,649 | $76,704 |
| 2020 | $1,792 | $172,566 | $96,648 | $75,918 |
| 2019 | $1,756 | $169,183 | $94,753 | $74,430 |
| 2018 | $1,724 | $165,866 | $92,895 | $72,971 |
| 2017 | $1,689 | $162,614 | $91,073 | $71,541 |
| 2016 | $1,661 | $159,426 | $89,287 | $70,139 |
| 2015 | $1,641 | $157,032 | $87,946 | $69,086 |
| 2014 | $1,605 | $153,956 | $86,223 | $67,733 |
Source: Public Records
Map
Nearby Homes
- 26302 Los Viveros Unit 152
- 26166 Los Viveros Unit 222
- 23641 Coronel Dr
- 26212 La Real Unit D
- 26205 La Real Unit E
- 23401 Via Linda Unit C
- 23201 Via Mirlo
- 23371 #E 290 Lacrescenta
- 23355 Via Linda Unit 3
- 23301 La Crescenta
- 26702 Via Linares
- 22922 Vía Nuez
- 26812 Via Llano
- 26328 Via Roble Unit 28
- 26368 Via Roble Unit 24
- 26253 Via Roble Unit 14
- 24102 Castilla Ln
- 26068 Via Pera
- 23372 Via Bahia
- 26158 Via Pera Unit E4
- 26375 Via Logrono
- 26385 Via Logrono
- 26371 Via Logrono
- 26391 Via Logrono
- 26361 Via Logrono
- 26395 Via Logrono
- 26391 Via Galicia
- 26351 Via Logrono
- 26412 Via Logrono
- 26401 Via Logrono
- 26372 Via Logrono
- 26401 Via Galicia
- 26341 Via Logrono
- 26362 Via Logrono
- 26411 Via Logrono
- 26411 Via Galicia
- 26415 Via Logrono
- 26331 Via Logrono
- 26421 Via Galicia
- 26356 Via Logrono