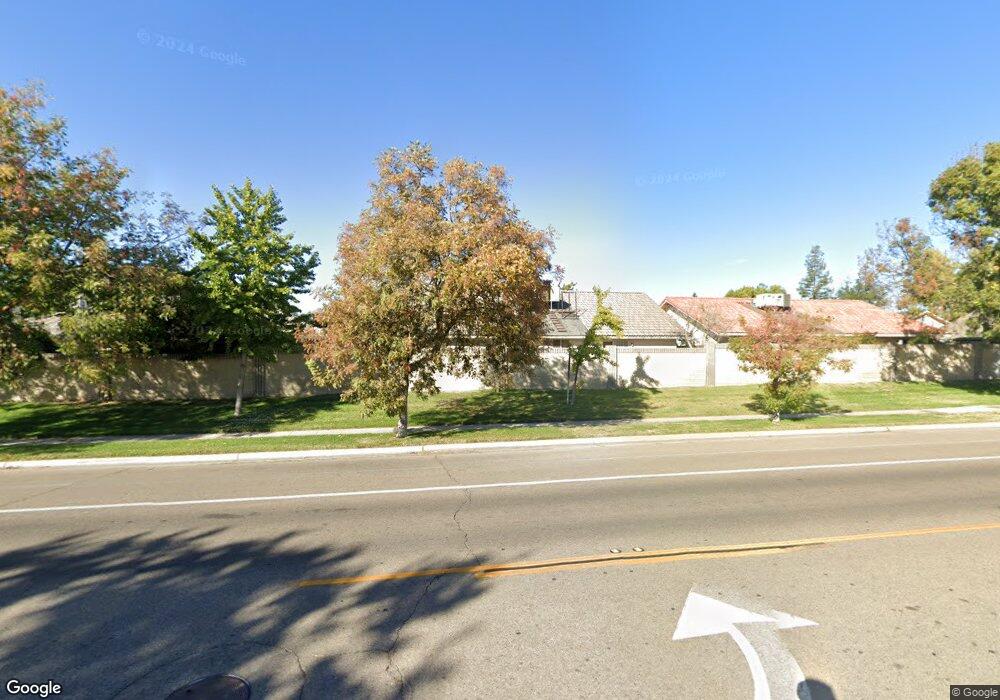
2639 Fowler Ave Clovis, CA 93611
Estimated Value: $361,114 - $404,000
3
Beds
2
Baths
1,462
Sq Ft
$267/Sq Ft
Est. Value
About This Home
This home is located at 2639 Fowler Ave, Clovis, CA 93611 and is currently estimated at $390,279, approximately $266 per square foot. 2639 Fowler Ave is a home located in Fresno County with nearby schools including Gettysburg Elementary School, Reyburn Intermediate School, and Clovis East High School.
Ownership History
Date
Name
Owned For
Owner Type
Purchase Details
Closed on
Mar 13, 2019
Sold by
Korpela Christina S
Bought by
Korpela Christina S and Christina S Korpela Estate Pla
Current Estimated Value
Purchase Details
Closed on
Aug 6, 2009
Sold by
Korpela Christina S
Bought by
Korpela Christina S
Purchase Details
Closed on
May 5, 2009
Sold by
Throckmorton Irene R
Bought by
Korpela Christina S
Purchase Details
Closed on
May 20, 1998
Sold by
Sanwa Bank California
Bought by
Throckmorton Dillon W and Throckmorton Irene R
Home Financials for this Owner
Home Financials are based on the most recent Mortgage that was taken out on this home.
Original Mortgage
$75,000
Interest Rate
7.17%
Purchase Details
Closed on
Feb 10, 1998
Sold by
Walker Mead Harold and Walker Andrea A
Bought by
Sanwa Bank California
Create a Home Valuation Report for This Property
The Home Valuation Report is an in-depth analysis detailing your home's value as well as a comparison with similar homes in the area
Home Values in the Area
Average Home Value in this Area
Purchase History
| Date | Buyer | Sale Price | Title Company |
|---|---|---|---|
| Korpela Christina S | -- | None Available | |
| Korpela Christina S | -- | None Available | |
| Korpela Christina S | -- | None Available | |
| Throckmorton Dillon W | $95,000 | Central Title Company | |
| Sanwa Bank California | $101,127 | American Title Co |
Source: Public Records
Mortgage History
| Date | Status | Borrower | Loan Amount |
|---|---|---|---|
| Previous Owner | Throckmorton Dillon W | $75,000 |
Source: Public Records
Tax History
| Year | Tax Paid | Tax Assessment Tax Assessment Total Assessment is a certain percentage of the fair market value that is determined by local assessors to be the total taxable value of land and additions on the property. | Land | Improvement |
|---|---|---|---|---|
| 2025 | $1,903 | $151,659 | $55,869 | $95,790 |
| 2023 | $1,835 | $145,771 | $53,700 | $92,071 |
| 2022 | $1,812 | $142,914 | $52,648 | $90,266 |
| 2021 | $1,765 | $140,113 | $51,616 | $88,497 |
| 2020 | $1,758 | $138,677 | $51,087 | $87,590 |
| 2019 | $1,726 | $135,959 | $50,086 | $85,873 |
| 2018 | $1,691 | $133,294 | $49,104 | $84,190 |
| 2017 | $1,651 | $130,682 | $48,142 | $82,540 |
| 2016 | $1,599 | $128,121 | $47,199 | $80,922 |
| 2015 | $1,576 | $126,198 | $46,491 | $79,707 |
| 2014 | $1,549 | $123,727 | $45,581 | $78,146 |
Source: Public Records
Map
Nearby Homes
- 2645 Fowler Ave
- 2612 Renn Ave
- 1707 Gettysburg Ave
- 1715 Donner Ave
- 2627 Stanford Ave
- 1608 Gettysburg Ave
- 1721 Holland Ave
- 2306 Stanford Ave
- 2684 Armstrong Ave
- 3074 Burgan Ave
- 3497 Shaw Ave
- 3099 Ezie Ave
- 2214 Fordham Ave
- 3110 Ezie Ave
- 2916 Miami Ave
- 3237 Whittier Ave
- 1607 Ashlan Ave
- 1286 Piazza Ln
- 2064 Ashlan Ave
- 1722 Buckingham Ave
- 2637 Fowler Ave
- 1854 Rialto Ct
- 1834 Rialto Ct
- 2660 Whittier Ave
- 2646 Whittier Ave
- 2659 Fowler Ave
- 2635 Fowler Ave
- 2657 Fowler Ave
- 1864 Rialto Ct
- 1814 Rialto Ct
- 2649 Fowler Ave
- 2633 Fowler Ave
- 2672 Whittier Ave
- 2677 Fowler Ave
- 1843 Rialto Ct
- 2675 Fowler Ave
- 2647 Fowler Ave
- 1823 Rialto Ct
- 2643 Whittier Ave
- 1863 Rialto Ct
Your Personal Tour Guide
Ask me questions while you tour the home.