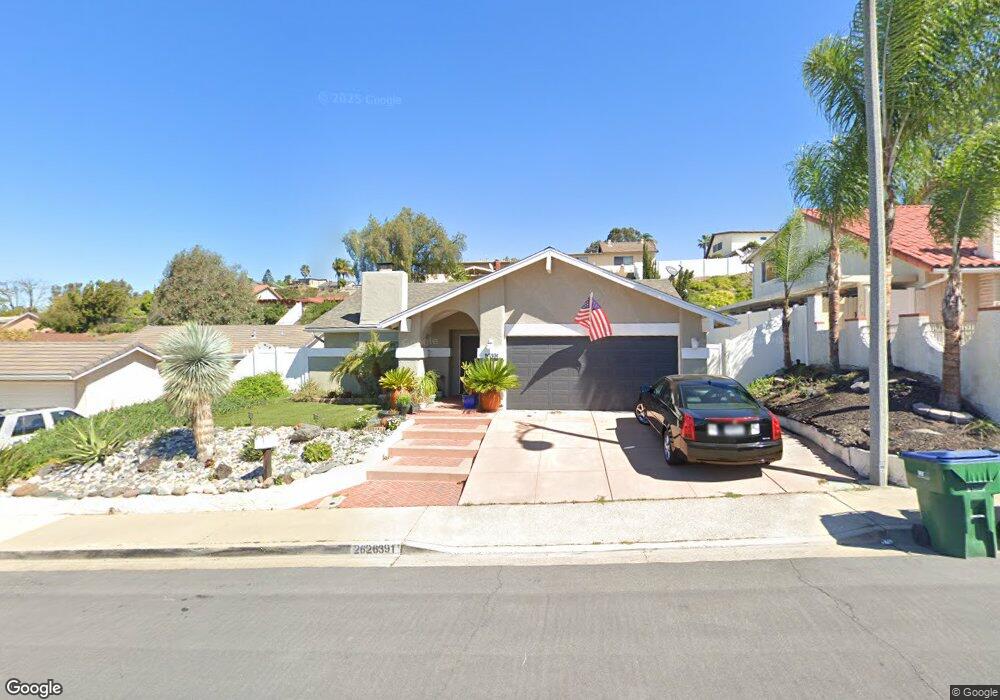
26391 Via Conchita Mission Viejo, CA 92691
Estimated Value: $1,024,000 - $1,345,000
2
Beds
2
Baths
1,212
Sq Ft
$940/Sq Ft
Est. Value
About This Home
This home is located at 26391 Via Conchita, Mission Viejo, CA 92691 and is currently estimated at $1,139,617, approximately $940 per square foot. 26391 Via Conchita is a home located in Orange County with nearby schools including Glen Yermo Elementary School, Los Alisos Intermediate School, and Trabuco Hills High School.
Ownership History
Date
Name
Owned For
Owner Type
Purchase Details
Closed on
Sep 7, 2017
Sold by
Bauer Joan Kimberly
Bought by
Bauer Joan Kimberly and Bauer Charles Joseph
Current Estimated Value
Purchase Details
Closed on
Jan 22, 2003
Sold by
Bauer Charles Joseph
Bought by
Bauer Joan Kimberly
Home Financials for this Owner
Home Financials are based on the most recent Mortgage that was taken out on this home.
Original Mortgage
$234,000
Outstanding Balance
$99,390
Interest Rate
5.96%
Estimated Equity
$1,040,227
Purchase Details
Closed on
Apr 14, 1997
Sold by
Dana Niguel Bank Na
Bought by
Bauer Charles Joseph and Bauer Joan Kimberly
Home Financials for this Owner
Home Financials are based on the most recent Mortgage that was taken out on this home.
Original Mortgage
$184,370
Interest Rate
7.96%
Mortgage Type
VA
Purchase Details
Closed on
Jan 17, 1997
Sold by
Rau Walter C
Bought by
Dana Niguel Bank Na
Create a Home Valuation Report for This Property
The Home Valuation Report is an in-depth analysis detailing your home's value as well as a comparison with similar homes in the area
Home Values in the Area
Average Home Value in this Area
Purchase History
| Date | Buyer | Sale Price | Title Company |
|---|---|---|---|
| Bauer Joan Kimberly | -- | None Available | |
| Bauer Joan Kimberly | -- | Multiple | |
| Bauer Charles Joseph | $179,000 | Chicago Title Co | |
| Dana Niguel Bank Na | $77,812 | Benefit Land Title Ins Co |
Source: Public Records
Mortgage History
| Date | Status | Borrower | Loan Amount |
|---|---|---|---|
| Open | Bauer Joan Kimberly | $234,000 | |
| Closed | Bauer Charles Joseph | $184,370 |
Source: Public Records
Tax History Compared to Growth
Tax History
| Year | Tax Paid | Tax Assessment Tax Assessment Total Assessment is a certain percentage of the fair market value that is determined by local assessors to be the total taxable value of land and additions on the property. | Land | Improvement |
|---|---|---|---|---|
| 2025 | $2,959 | $291,522 | $179,096 | $112,426 |
| 2024 | $2,959 | $285,806 | $175,584 | $110,222 |
| 2023 | $2,889 | $280,202 | $172,141 | $108,061 |
| 2022 | $2,838 | $274,708 | $168,765 | $105,943 |
| 2021 | $2,782 | $269,322 | $165,456 | $103,866 |
| 2020 | $2,757 | $266,561 | $163,760 | $102,801 |
| 2019 | $2,702 | $261,335 | $160,549 | $100,786 |
| 2018 | $2,652 | $256,211 | $157,401 | $98,810 |
| 2017 | $2,599 | $251,188 | $154,315 | $96,873 |
| 2016 | $2,556 | $246,263 | $151,289 | $94,974 |
| 2015 | $2,525 | $242,564 | $149,016 | $93,548 |
| 2014 | $2,470 | $237,813 | $146,097 | $91,716 |
Source: Public Records
Map
Nearby Homes
- 26331 Via Lara
- 26451 Via Juanita
- 22642 La Quinta Dr
- 26242 Brookhollow
- 22922 Vía Nuez
- 26253 Via Roble Unit 14
- 26328 Via Roble Unit 28
- 26258 Via Roble Unit 36
- 26368 Via Roble Unit 24
- 22421 Rippling Brook
- 22322 Silent Brook
- 22292 Silent Brook
- 22735 Via Santa Rosa
- 23201 Via Mirlo
- 26158 Via Pera Unit E4
- 26068 Via Pera
- 25885 Trabuco Rd Unit 206
- 25885 Trabuco Rd Unit 91
- 25885 Trabuco Rd Unit 306
- 25885 Trabuco Rd Unit 33
- 26381 Via Conchita
- 26401 Via Conchita
- 26371 Vía Conchita
- 26371 Via Conchita #263
- 26371 Via Conchita Unit A
- 26371 Via Conchita
- 26371 Via Conchita Unit A
- 26371 Via Conchita
- 26432 Mimosa Ln
- 26422 Mimosa Ln
- 26415 Via Conchita
- 26442 Mimosa Ln
- 26392 Via Conchita
- 26382 Via Conchita
- 26431 Via Conchita
- 26402 Via Conchita
- 26372 Via Conchita
- 26402 Mimosa Ln
- 26452 Mimosa Ln
- 26362 Via Conchita