Estimated Value: $638,000 - $760,000
5
Beds
4
Baths
4,225
Sq Ft
$161/Sq Ft
Est. Value
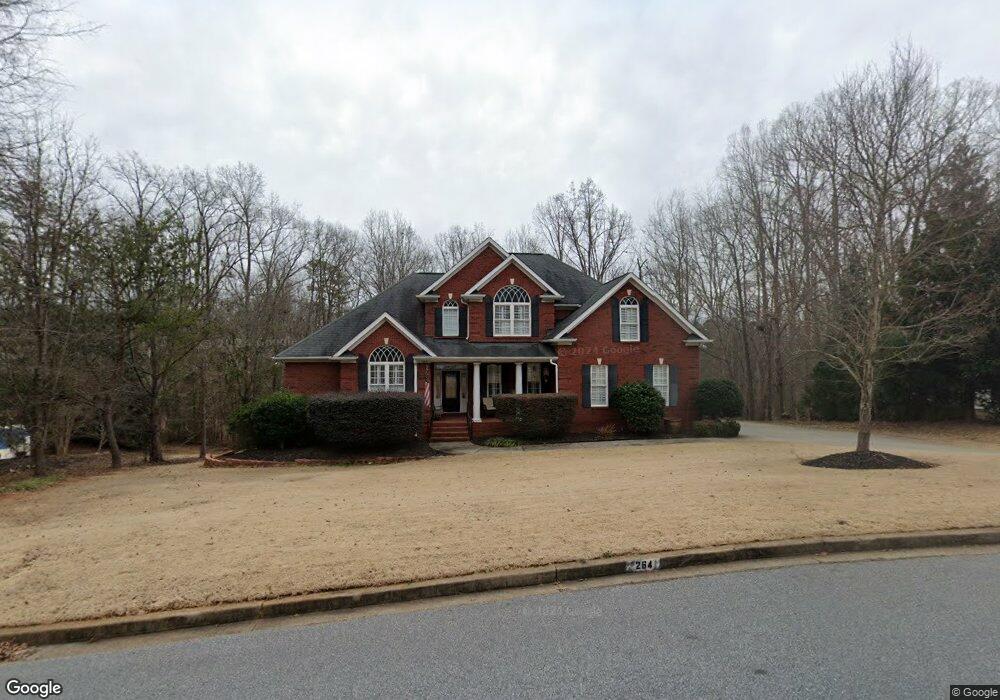
About This Home
This home is located at 264 Antrim Ave, Moore, SC 29369 and is currently estimated at $679,347, approximately $160 per square foot. 264 Antrim Ave is a home located in Spartanburg County with nearby schools including Dorman High School Freshman Campus, Dorman High School, and GREEN Charter School Spartanburg.
Ownership History
Date
Name
Owned For
Owner Type
Purchase Details
Closed on
Nov 9, 2011
Sold by
Federal Home Loan Mortgage Corporation
Bought by
Wilson Jonah S and Wilson Kimberlys
Current Estimated Value
Home Financials for this Owner
Home Financials are based on the most recent Mortgage that was taken out on this home.
Original Mortgage
$339,150
Outstanding Balance
$232,714
Interest Rate
4.15%
Mortgage Type
New Conventional
Estimated Equity
$446,633
Purchase Details
Closed on
Oct 4, 2010
Sold by
White Thomas P and White Kelli H
Bought by
Federal Home Loan Mortgage Corp
Purchase Details
Closed on
Dec 3, 2007
Sold by
Upstate Home Builders Llc
Bought by
White Thomas P and White Kelli H
Home Financials for this Owner
Home Financials are based on the most recent Mortgage that was taken out on this home.
Original Mortgage
$417,000
Interest Rate
6.22%
Mortgage Type
Unknown
Purchase Details
Closed on
Mar 9, 2006
Sold by
Griffin Marion R and Bruce Foster J
Bought by
Upstate Home Builders Llc
Create a Home Valuation Report for This Property
The Home Valuation Report is an in-depth analysis detailing your home's value as well as a comparison with similar homes in the area
Home Values in the Area
Average Home Value in this Area
Purchase History
| Date | Buyer | Sale Price | Title Company |
|---|---|---|---|
| Wilson Jonah S | $357,000 | -- | |
| Federal Home Loan Mortgage Corp | $2,500 | -- | |
| White Thomas P | $417,000 | Attorney | |
| Upstate Home Builders Llc | $32,000 | None Available |
Source: Public Records
Mortgage History
| Date | Status | Borrower | Loan Amount |
|---|---|---|---|
| Open | Wilson Jonah S | $339,150 | |
| Previous Owner | White Thomas P | $417,000 |
Source: Public Records
Tax History
| Year | Tax Paid | Tax Assessment Tax Assessment Total Assessment is a certain percentage of the fair market value that is determined by local assessors to be the total taxable value of land and additions on the property. | Land | Improvement |
|---|---|---|---|---|
| 2022 | $2,560 | $14,576 | $2,664 | $11,912 |
| 2021 | $2,560 | $14,576 | $2,664 | $11,912 |
| 2020 | $2,502 | $14,576 | $2,664 | $11,912 |
| 2019 | $2,480 | $14,576 | $2,664 | $11,912 |
| 2018 | $2,458 | $14,576 | $2,664 | $11,912 |
| 2017 | $2,212 | $13,348 | $2,664 | $10,684 |
| 2016 | $2,165 | $13,348 | $2,664 | $10,684 |
| 2015 | $2,188 | $13,348 | $2,664 | $10,684 |
| 2014 | $2,122 | $13,348 | $2,664 | $10,684 |
Source: Public Records
Map
Nearby Homes
- 123 Blairfield Ct
- 287 Antrim Ave
- 317 E Killarney Lake
- 169 Nicholls Dr
- 641 Monfret Ct
- 631 Monfret Ct
- 759 Rodin Rd
- 767 Rodin Rd
- 789 Baker Way
- 617 Monfret Ct
- 607 Monfret Ct
- 00 Reidville
- 606 Monfret Ct
- 108 Kirkwood Dr
- 105 Pimmitt Run
- 507 Thornhill Dr
- 105 Pimmit Run
- 207 Woodgrove Trace
- 410 Thornhill Dr
- 101 Stockton Ln
- 260 Antrim Ave
- 352 Meathward Cir
- 344 Meathward Cir
- 253 Antrim Ave
- 252 & 256 Antrim
- 364 Meathward Cir
- 338 Meathward Cir
- 267 Antrim Ave
- 332 Meathward Cir
- 243 Antrim Ave
- 252 Antrim Ave
- 326 Meathward Cir
- 271 Antrim Ave
- 367 Meathward Cir
- 357 Meathward Cir
- 276 Antrim Ave
- 248 Antrim Ave
- 347 Meathward Cir
- 239 Antrim Ave
- 337 Meathward Cir
Your Personal Tour Guide
Ask me questions while you tour the home.