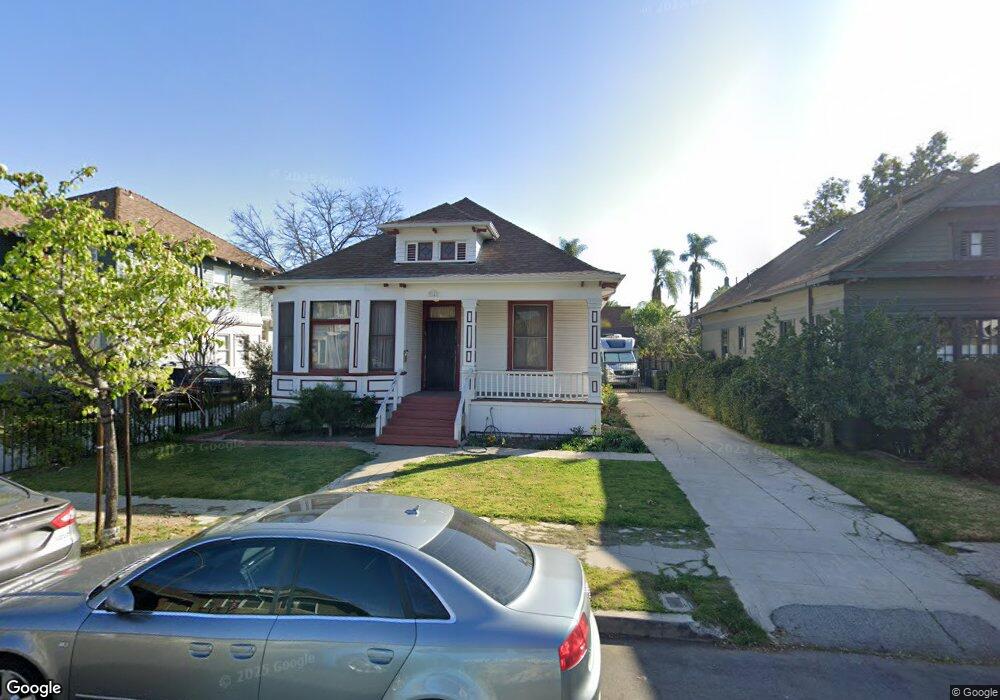
2640 Magnolia Ave Los Angeles, CA 90007
University Park NeighborhoodEstimated Value: $1,078,000 - $1,594,000
5
Beds
5
Baths
1,200
Sq Ft
$1,142/Sq Ft
Est. Value
About This Home
This home is located at 2640 Magnolia Ave, Los Angeles, CA 90007 and is currently estimated at $1,370,344, approximately $1,141 per square foot. 2640 Magnolia Ave is a home located in Los Angeles County with nearby schools including Vermont Avenue Elementary School, John Adams Middle School, and Manual Arts Senior High School.
Ownership History
Date
Name
Owned For
Owner Type
Purchase Details
Closed on
Oct 7, 2020
Sold by
Cheng Annette L and Cheng Joseph I
Bought by
Auburn San Pedro Llc
Current Estimated Value
Home Financials for this Owner
Home Financials are based on the most recent Mortgage that was taken out on this home.
Original Mortgage
$1,170,360
Outstanding Balance
$1,036,691
Interest Rate
2.8%
Mortgage Type
Construction
Estimated Equity
$333,653
Purchase Details
Closed on
Mar 21, 2008
Sold by
Cheng Hsiu Lang W
Bought by
Cheng Ellen Wang and Ellen Wang Cheng 2008 Revocable Trust
Purchase Details
Closed on
Jan 30, 2008
Sold by
Cheng Joseph I
Bought by
Cheng Hsiu Lang W and Cheng Ellen Wang
Purchase Details
Closed on
Jul 7, 2000
Sold by
Cheng Hslu Lan W
Bought by
Cheng Hsiu Lang W and Cheng Joseph I
Home Financials for this Owner
Home Financials are based on the most recent Mortgage that was taken out on this home.
Original Mortgage
$40,000
Interest Rate
8.55%
Create a Home Valuation Report for This Property
The Home Valuation Report is an in-depth analysis detailing your home's value as well as a comparison with similar homes in the area
Home Values in the Area
Average Home Value in this Area
Purchase History
| Date | Buyer | Sale Price | Title Company |
|---|---|---|---|
| Auburn San Pedro Llc | $1,150,000 | Lawyers Title Company | |
| Cheng Ellen Wang | -- | None Available | |
| Cheng Hsiu Lang W | -- | None Available | |
| Cheng Hsiu Lang W | -- | First American Title Co |
Source: Public Records
Mortgage History
| Date | Status | Borrower | Loan Amount |
|---|---|---|---|
| Open | Auburn San Pedro Llc | $1,170,360 | |
| Previous Owner | Cheng Hsiu Lang W | $40,000 |
Source: Public Records
Tax History Compared to Growth
Tax History
| Year | Tax Paid | Tax Assessment Tax Assessment Total Assessment is a certain percentage of the fair market value that is determined by local assessors to be the total taxable value of land and additions on the property. | Land | Improvement |
|---|---|---|---|---|
| 2025 | $15,471 | $1,287,603 | $1,071,606 | $215,997 |
| 2024 | $15,471 | $1,262,357 | $1,050,595 | $211,762 |
| 2023 | $15,174 | $1,237,606 | $1,029,996 | $207,610 |
| 2022 | $14,471 | $1,213,340 | $1,009,800 | $203,540 |
| 2021 | $13,830 | $1,150,000 | $990,000 | $160,000 |
| 2020 | $914 | $57,110 | $44,085 | $13,025 |
| 2019 | $888 | $55,991 | $43,221 | $12,770 |
| 2018 | $792 | $54,894 | $42,374 | $12,520 |
| 2016 | $743 | $52,765 | $40,730 | $12,035 |
| 2015 | $734 | $51,974 | $40,119 | $11,855 |
| 2014 | $747 | $50,957 | $39,334 | $11,623 |
Source: Public Records
Map
Nearby Homes
- 1208 W 25th St
- 1220 W 25th St
- 1257 W Adams Blvd
- 1220 W 27th St
- 1016 W 24th St
- 1213 W 24th St
- 1017 W 24th St
- 2623 Ellendale Place
- 1275 W 23rd St
- 1276 W 22nd St
- 1150 W 29th St
- 1102 W 29th St
- 1241 W 22nd St
- 2119 S Union Ave
- 2107 S Union Ave
- 947 W 30th St
- 1038 W 21st St
- 1420 W 22nd St
- 2109 Toberman St
- 647 W 28th St
- 2636 Magnolia Ave
- 2646 Magnolia Ave
- 2630 Magnolia Ave
- 2650 Magnolia Ave
- 1172 W Adams Blvd
- 2620 Magnolia Ave
- 2656 Magnolia Ave
- 1170 W Adams Blvd
- 2641 Magnolia Ave
- 2639 Magnolia Ave
- 2647 Magnolia Ave
- 2633 Magnolia Ave
- 2660 Magnolia Ave
- 2651 Magnolia Ave
- 2629 Magnolia Ave
- 2627 Magnolia Ave
- 2657 Magnolia Ave
- 1176 W Adams Blvd
- 1158 W Adams Blvd
- 2621 S Magnolia Ave