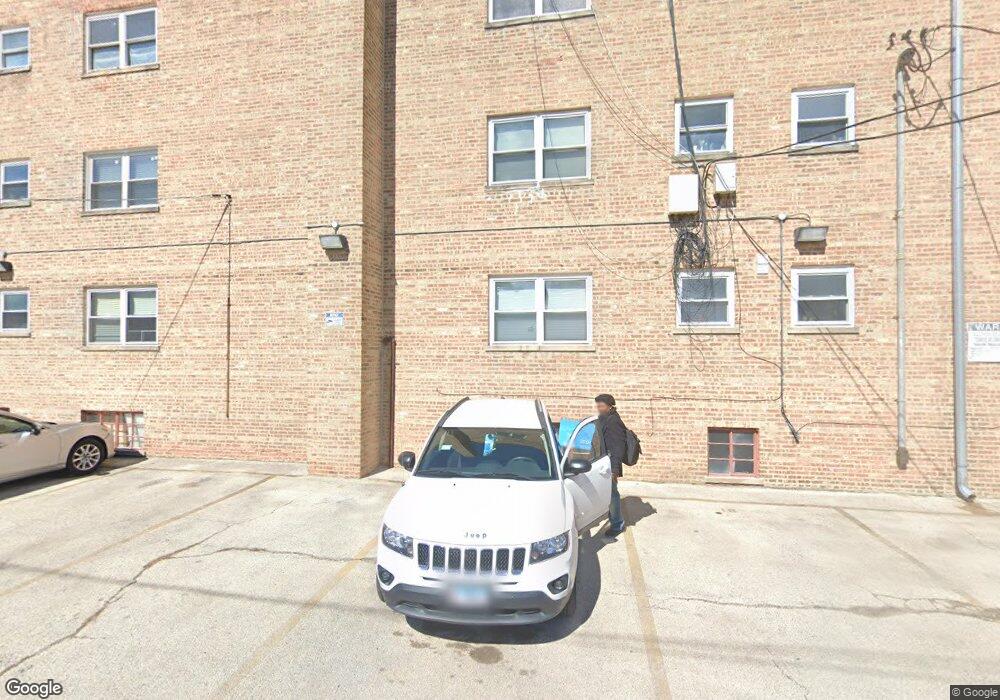
2641 W Fitch Ave Unit 26413 Chicago, IL 60645
West Ridge NeighborhoodEstimated Value: $173,000 - $189,518
2
Beds
2
Baths
1,000
Sq Ft
$184/Sq Ft
Est. Value
About This Home
This home is located at 2641 W Fitch Ave Unit 26413, Chicago, IL 60645 and is currently estimated at $183,880, approximately $183 per square foot. 2641 W Fitch Ave Unit 26413 is a home located in Cook County with nearby schools including Rogers Elementary School, Mather High School, and Bethesda International Academy.
Ownership History
Date
Name
Owned For
Owner Type
Purchase Details
Closed on
Jan 31, 2025
Sold by
Metoyer John Hamilton
Bought by
Boehlen Christine
Current Estimated Value
Home Financials for this Owner
Home Financials are based on the most recent Mortgage that was taken out on this home.
Original Mortgage
$167,200
Outstanding Balance
$166,224
Interest Rate
7%
Mortgage Type
New Conventional
Estimated Equity
$17,656
Purchase Details
Closed on
Oct 27, 2003
Sold by
Goldstein Joseph
Bought by
Metoyer John Hamilton
Home Financials for this Owner
Home Financials are based on the most recent Mortgage that was taken out on this home.
Original Mortgage
$164,800
Interest Rate
6.02%
Mortgage Type
Unknown
Purchase Details
Closed on
Jul 14, 1998
Sold by
Polevoy Rimma
Bought by
Goldstein Joseph
Purchase Details
Closed on
Jan 28, 1997
Sold by
Park Gdns Co Operative Apartments Corp
Bought by
Polevoy Rimma
Create a Home Valuation Report for This Property
The Home Valuation Report is an in-depth analysis detailing your home's value as well as a comparison with similar homes in the area
Home Values in the Area
Average Home Value in this Area
Purchase History
| Date | Buyer | Sale Price | Title Company |
|---|---|---|---|
| Boehlen Christine | $176,000 | None Listed On Document | |
| Metoyer John Hamilton | $160,000 | M G R Title | |
| Goldstein Joseph | $81,500 | -- | |
| Polevoy Rimma | -- | -- |
Source: Public Records
Mortgage History
| Date | Status | Borrower | Loan Amount |
|---|---|---|---|
| Open | Boehlen Christine | $167,200 | |
| Previous Owner | Metoyer John Hamilton | $164,800 |
Source: Public Records
Tax History Compared to Growth
Tax History
| Year | Tax Paid | Tax Assessment Tax Assessment Total Assessment is a certain percentage of the fair market value that is determined by local assessors to be the total taxable value of land and additions on the property. | Land | Improvement |
|---|---|---|---|---|
| 2024 | $1,621 | $16,095 | $2,723 | $13,372 |
| 2023 | $1,559 | $11,000 | $2,179 | $8,821 |
| 2022 | $1,559 | $11,000 | $2,179 | $8,821 |
| 2021 | $1,542 | $10,999 | $2,178 | $8,821 |
| 2020 | $543 | $5,538 | $1,579 | $3,959 |
| 2019 | $554 | $6,185 | $1,579 | $4,606 |
| 2018 | $543 | $6,185 | $1,579 | $4,606 |
| 2017 | $711 | $6,679 | $1,416 | $5,263 |
| 2016 | $838 | $6,679 | $1,416 | $5,263 |
| 2015 | $743 | $6,679 | $1,416 | $5,263 |
| 2014 | $1,213 | $8,230 | $1,307 | $6,923 |
| 2013 | $1,785 | $12,445 | $1,307 | $11,138 |
Source: Public Records
Map
Nearby Homes
- 2650 W Touhy Ave
- 2626 W Lunt Ave
- 2545 W Coyle Ave
- 2424 W Estes Ave Unit 1C
- 2424 W Estes Ave Unit 3B
- 7249 N Campbell Ave Unit B
- 2509 W Morse Ave
- 2416 W Morse Ave
- 6800 N California Ave Unit 3S
- 6800 N California Ave Unit 2I
- 6800 N California Ave Unit 2M
- 2522 W Jarvis Ave
- 7433 N Washtenaw Ave
- 7129 N Oakley Ave
- 6734 N Campbell Ave
- 6727 N Maplewood Ave
- 2322 W Farwell Ave Unit 1W
- 7061 N Kedzie Ave Unit 706
- 2325 W Farwell Ave Unit 2S
- 2224 W Touhy Ave Unit 3N
- 2641 W Fitch Ave Unit 26411
- 2641 W Fitch Ave Unit 26412
- 2641 W Fitch Ave Unit 1
- 2641 W Fitch Ave Unit 2
- 2637 W Fitch Ave Unit 26372
- 2637 W Fitch Ave Unit 26371
- 2637 W Fitch Ave Unit 26373
- 2637 W Fitch Ave Unit 1E
- 2637 W Fitch Ave Unit 3E
- 2637 W Fitch Ave Unit 2A
- 2637 W Fitch Ave Unit 1A
- 2643 W Fitch Ave Unit 26433
- 2643 W Fitch Ave Unit 26432
- 2643 W Fitch Ave Unit 26431
- 2643 W Fitch Ave Unit 1
- 2639 W Fitch Ave Unit 26392
- 2639 W Fitch Ave Unit 26391
- 2639 W Fitch Ave Unit 26393
- 2639 W Fitch Ave Unit 2
- 2647 W Fitch Ave Unit 2