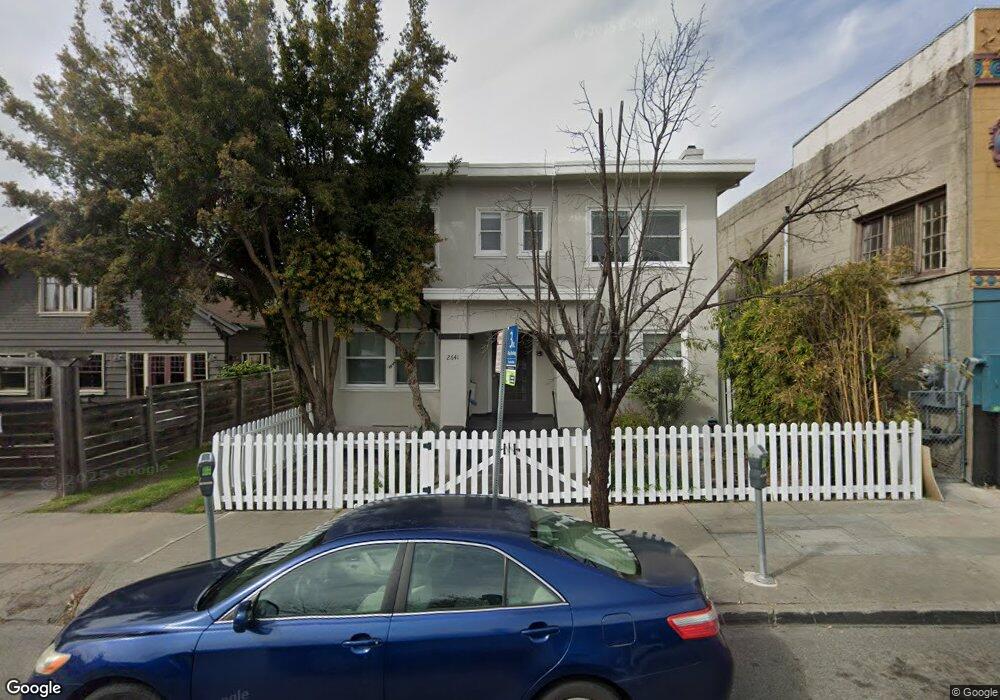
2641 Webster St Unit 4 Berkeley, CA 94705
Elmwood NeighborhoodEstimated Value: $536,454 - $771,000
1
Bed
1
Bath
587
Sq Ft
$1,042/Sq Ft
Est. Value
About This Home
This home is located at 2641 Webster St Unit 4, Berkeley, CA 94705 and is currently estimated at $611,614, approximately $1,041 per square foot. 2641 Webster St Unit 4 is a home located in Alameda County with nearby schools including Emerson Elementary School, John Muir Elementary School, and Malcolm X Elementary School.
Ownership History
Date
Name
Owned For
Owner Type
Purchase Details
Closed on
Apr 11, 2018
Sold by
Lockwood Gwynn
Bought by
Randall Jacob
Current Estimated Value
Home Financials for this Owner
Home Financials are based on the most recent Mortgage that was taken out on this home.
Original Mortgage
$433,600
Outstanding Balance
$373,062
Interest Rate
4.46%
Mortgage Type
New Conventional
Estimated Equity
$238,552
Purchase Details
Closed on
Aug 19, 1998
Sold by
Bass Susan
Bought by
Lockwood Gwynn
Home Financials for this Owner
Home Financials are based on the most recent Mortgage that was taken out on this home.
Original Mortgage
$112,400
Interest Rate
6.91%
Purchase Details
Closed on
May 25, 1995
Sold by
Yao Da Juin and Tsao Lien
Bought by
Bass Susan
Create a Home Valuation Report for This Property
The Home Valuation Report is an in-depth analysis detailing your home's value as well as a comparison with similar homes in the area
Home Values in the Area
Average Home Value in this Area
Purchase History
| Date | Buyer | Sale Price | Title Company |
|---|---|---|---|
| Randall Jacob | $542,000 | Chicago Title Company | |
| Lockwood Gwynn | $141,000 | Placer Title Company | |
| Bass Susan | -- | First American Title Guarant |
Source: Public Records
Mortgage History
| Date | Status | Borrower | Loan Amount |
|---|---|---|---|
| Open | Randall Jacob | $433,600 | |
| Previous Owner | Lockwood Gwynn | $112,400 |
Source: Public Records
Tax History
| Year | Tax Paid | Tax Assessment Tax Assessment Total Assessment is a certain percentage of the fair market value that is determined by local assessors to be the total taxable value of land and additions on the property. | Land | Improvement |
|---|---|---|---|---|
| 2025 | $8,590 | $609,692 | $185,007 | $431,685 |
| 2024 | $8,590 | $597,600 | $181,380 | $423,220 |
| 2023 | $8,418 | $592,747 | $177,824 | $414,923 |
| 2022 | $8,286 | $574,126 | $174,338 | $406,788 |
| 2021 | $8,315 | $562,733 | $170,920 | $398,813 |
| 2020 | $7,936 | $563,896 | $169,169 | $394,727 |
| 2019 | $7,694 | $552,840 | $165,852 | $386,988 |
| 2018 | $3,393 | $194,263 | $58,279 | $135,984 |
| 2017 | $3,251 | $190,455 | $57,136 | $133,319 |
| 2016 | $3,129 | $186,721 | $56,016 | $130,705 |
| 2015 | $3,085 | $183,917 | $55,175 | $128,742 |
| 2014 | $3,060 | $180,314 | $54,094 | $126,220 |
Source: Public Records
Map
Nearby Homes
- 2962 Piedmont Ave
- 2477 Prince St
- 2935 Florence St
- 6446 Colby St
- 2643 Stuart St
- 360 Alcatraz Ave
- 2917 Telegraph Ave
- 2817 Palm Ct
- 2243 Ashby Ave
- 3046 Deakin St
- 2632 Warring St Unit 3
- 2702 Dana St
- 6445 Irwin Ct
- 2319 Ward St
- 2601 College Ave Unit 203
- 2601 College Ave Unit 208
- 2611 Piedmont Ave Unit 4
- 6100 Chabot Rd
- 2923 Wheeler St
- 556 Alcatraz Ave
- 2641 Webster St
- 2641 Webster St Unit 3
- 2641 Webster St Unit 1
- 2635 Webster St
- 2986 College Ave
- 2992 College Ave
- 2631 Webster St
- 2974-2980 College Ave
- 3000 College Ave
- 2961 Benvenue Ave
- 2953 Benvenue Ave
- 2957 Benvenue Ave
- 3004 College Ave
- 2630 Webster St
- 3001 Benvenue Ave
- 2987 College Ave
- 3006 College Ave
- 3005 Benvenue Ave
- 2644 Ashby Ave
- 3007 Benvenue Ave
Your Personal Tour Guide
Ask me questions while you tour the home.