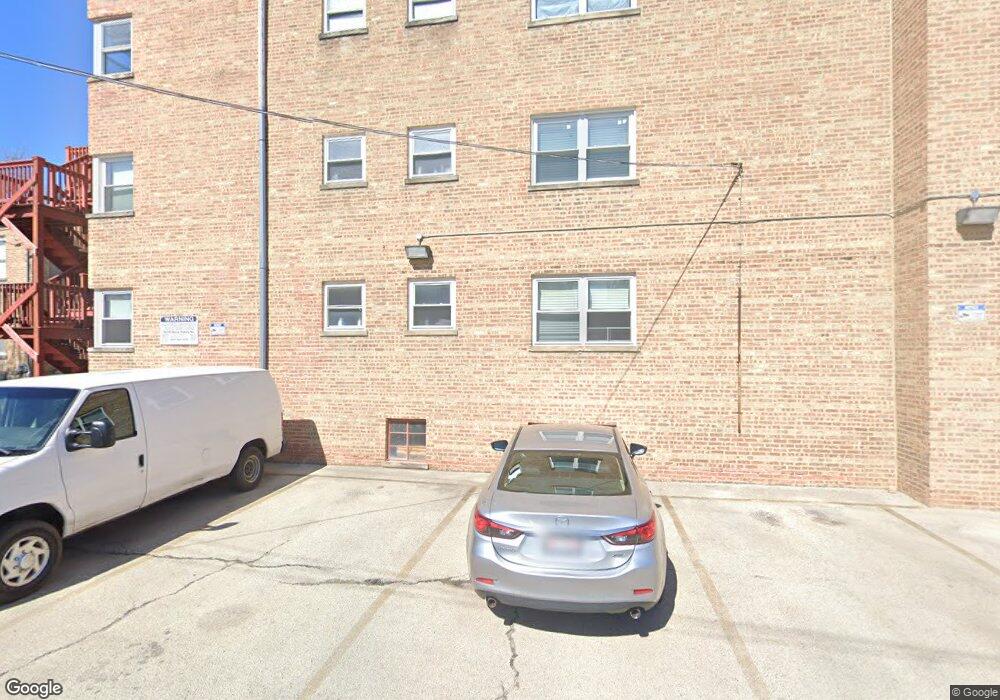
2643 W Fitch Ave Unit 26432 Chicago, IL 60645
West Ridge NeighborhoodEstimated Value: $162,000 - $201,000
2
Beds
1
Bath
25,904
Sq Ft
$7/Sq Ft
Est. Value
About This Home
This home is located at 2643 W Fitch Ave Unit 26432, Chicago, IL 60645 and is currently estimated at $175,205, approximately $6 per square foot. 2643 W Fitch Ave Unit 26432 is a home located in Cook County with nearby schools including Rogers Elementary School, Mather High School, and Bethesda International Academy.
Ownership History
Date
Name
Owned For
Owner Type
Purchase Details
Closed on
Nov 8, 2018
Sold by
Goodman Ruth
Bought by
Dvora David E
Current Estimated Value
Home Financials for this Owner
Home Financials are based on the most recent Mortgage that was taken out on this home.
Original Mortgage
$58,000
Outstanding Balance
$51,096
Interest Rate
4.99%
Mortgage Type
New Conventional
Estimated Equity
$124,109
Purchase Details
Closed on
Feb 5, 2013
Sold by
Goodman Ruth
Bought by
Goodman Ruth and Ruth Goodman Trust
Purchase Details
Closed on
Oct 23, 2012
Sold by
Goodman Joshua D and Goodman Wylie A
Bought by
Goodman Ruth
Purchase Details
Closed on
Mar 23, 2005
Sold by
Goodman Ivan and Goodman Ruth
Bought by
Goodman Ivan and Goodman Ruth
Purchase Details
Closed on
Jan 28, 1997
Sold by
Park Gdns Co Operative Apartments Corp
Bought by
Goodman Ivan and Goodman Ruth
Create a Home Valuation Report for This Property
The Home Valuation Report is an in-depth analysis detailing your home's value as well as a comparison with similar homes in the area
Home Values in the Area
Average Home Value in this Area
Purchase History
| Date | Buyer | Sale Price | Title Company |
|---|---|---|---|
| Dvora David E | $80,000 | Greater Illinois Title | |
| Dvora David E | -- | Greater Illinois Title | |
| Goodman Ruth | -- | None Available | |
| Goodman Ruth | -- | -- | |
| Goodman Ruth | -- | -- | |
| Goodman Ivan | -- | -- | |
| Goodman Ivan | -- | -- |
Source: Public Records
Mortgage History
| Date | Status | Borrower | Loan Amount |
|---|---|---|---|
| Open | Dvora David E | $58,000 |
Source: Public Records
Tax History Compared to Growth
Tax History
| Year | Tax Paid | Tax Assessment Tax Assessment Total Assessment is a certain percentage of the fair market value that is determined by local assessors to be the total taxable value of land and additions on the property. | Land | Improvement |
|---|---|---|---|---|
| 2024 | $2,321 | $16,691 | $2,824 | $13,867 |
| 2023 | $2,262 | $11,000 | $2,259 | $8,741 |
| 2022 | $2,262 | $11,000 | $2,259 | $8,741 |
| 2021 | $2,212 | $10,999 | $2,259 | $8,740 |
| 2020 | $1,280 | $5,744 | $1,638 | $4,106 |
| 2019 | $1,289 | $6,415 | $1,638 | $4,777 |
| 2018 | $1,267 | $6,415 | $1,638 | $4,777 |
| 2017 | $1,491 | $6,926 | $1,468 | $5,458 |
| 2016 | $1,387 | $6,926 | $1,468 | $5,458 |
| 2015 | $1,269 | $6,926 | $1,468 | $5,458 |
| 2014 | $1,584 | $8,535 | $1,355 | $7,180 |
| 2013 | $2,347 | $12,905 | $1,355 | $11,550 |
Source: Public Records
Map
Nearby Homes
- 2650 W Touhy Ave
- 2626 W Lunt Ave
- 2545 W Coyle Ave
- 2424 W Estes Ave Unit 1C
- 2424 W Estes Ave Unit 3B
- 7249 N Campbell Ave Unit B
- 2509 W Morse Ave
- 2416 W Morse Ave
- 6800 N California Ave Unit 3S
- 6800 N California Ave Unit 2I
- 6800 N California Ave Unit 2M
- 2522 W Jarvis Ave
- 7433 N Washtenaw Ave
- 7129 N Oakley Ave
- 6734 N Campbell Ave
- 6727 N Maplewood Ave
- 2322 W Farwell Ave Unit 1W
- 7061 N Kedzie Ave Unit 706
- 2325 W Farwell Ave Unit 2S
- 2224 W Touhy Ave Unit 3N
- 2643 W Fitch Ave Unit 26433
- 2643 W Fitch Ave Unit 26431
- 2643 W Fitch Ave Unit 1
- 2641 W Fitch Ave Unit 26411
- 2641 W Fitch Ave Unit 26413
- 2641 W Fitch Ave Unit 26412
- 2641 W Fitch Ave Unit 1
- 2641 W Fitch Ave Unit 2
- 2645 W Fitch Ave Unit 2
- 2645 W Fitch Ave Unit 26453
- 2645 W Fitch Ave Unit 26452
- 2645 W Fitch Ave Unit 26451
- 2645 W Fitch Ave Unit 3
- 2647 W Fitch Ave Unit 2
- 2647 W Fitch Ave Unit 26471
- 2647 W Fitch Ave Unit 26472
- 2647 W Fitch Ave Unit 26473
- 2637 W Fitch Ave Unit 26372
- 2637 W Fitch Ave Unit 26371
- 2637 W Fitch Ave Unit 26373