Estimated Value: $457,000 - $537,000
4
Beds
3
Baths
2,609
Sq Ft
$187/Sq Ft
Est. Value
About This Home
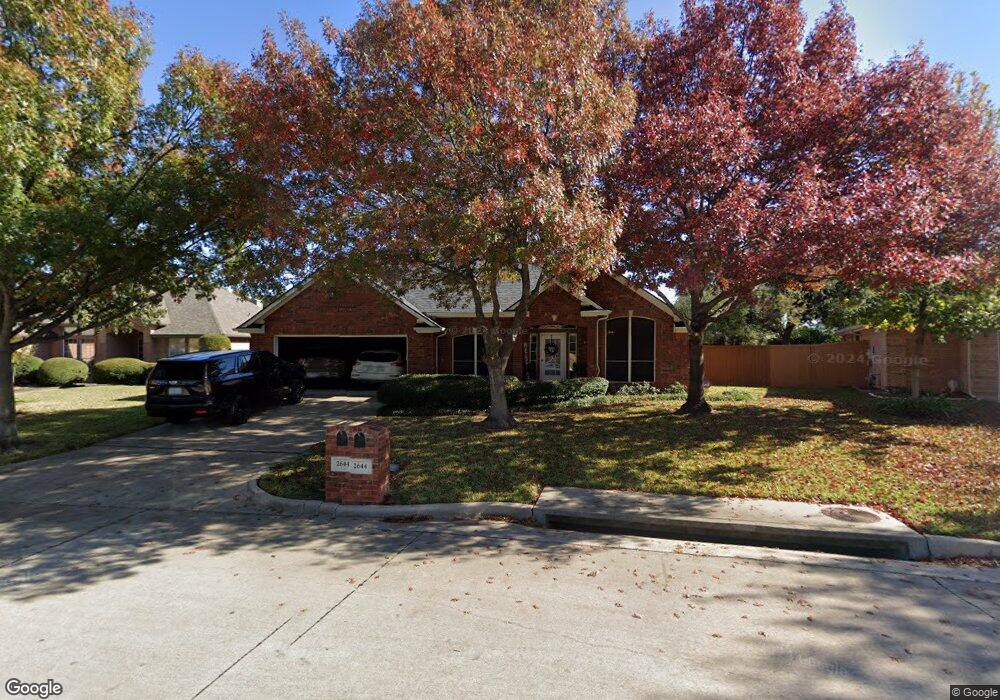
This home is located at 2644 Bent Tree Dr, Hurst, TX 76054 and is currently estimated at $488,418, approximately $187 per square foot. 2644 Bent Tree Dr is a home located in Tarrant County with nearby schools including Walker Creek Elementary School, Smithfield Middle School, and Birdville High School.
Ownership History
Date
Name
Owned For
Owner Type
Purchase Details
Closed on
Aug 31, 2009
Sold by
Rance Brett A
Bought by
Thompson Dwight E and Thompson Beth L
Current Estimated Value
Home Financials for this Owner
Home Financials are based on the most recent Mortgage that was taken out on this home.
Original Mortgage
$141,500
Outstanding Balance
$91,834
Interest Rate
5.2%
Mortgage Type
New Conventional
Estimated Equity
$396,584
Purchase Details
Closed on
Jun 26, 1997
Sold by
Mira Investments Inc
Bought by
Arbuckle James B and Rance Brett A
Home Financials for this Owner
Home Financials are based on the most recent Mortgage that was taken out on this home.
Original Mortgage
$145,350
Interest Rate
7.93%
Purchase Details
Closed on
Apr 17, 1996
Sold by
Margaret Development Ltd
Bought by
Mira Investments Inc
Create a Home Valuation Report for This Property
The Home Valuation Report is an in-depth analysis detailing your home's value as well as a comparison with similar homes in the area
Home Values in the Area
Average Home Value in this Area
Purchase History
| Date | Buyer | Sale Price | Title Company |
|---|---|---|---|
| Thompson Dwight E | -- | Stnt | |
| Arbuckle James B | -- | -- | |
| Mira Investments Inc | -- | Fidelity National Title Agen |
Source: Public Records
Mortgage History
| Date | Status | Borrower | Loan Amount |
|---|---|---|---|
| Open | Thompson Dwight E | $141,500 | |
| Previous Owner | Arbuckle James B | $145,350 |
Source: Public Records
Tax History
| Year | Tax Paid | Tax Assessment Tax Assessment Total Assessment is a certain percentage of the fair market value that is determined by local assessors to be the total taxable value of land and additions on the property. | Land | Improvement |
|---|---|---|---|---|
| 2025 | $4,486 | $400,000 | $65,000 | $335,000 |
| 2024 | $4,486 | $455,000 | $65,000 | $390,000 |
| 2023 | $8,794 | $419,902 | $65,000 | $354,902 |
| 2022 | $8,649 | $359,578 | $45,000 | $314,578 |
| 2021 | $8,249 | $318,000 | $45,000 | $273,000 |
| 2020 | $8,172 | $318,000 | $45,000 | $273,000 |
| 2019 | $7,926 | $333,761 | $45,000 | $288,761 |
| 2018 | $6,524 | $274,143 | $45,000 | $229,143 |
| 2017 | $7,477 | $280,188 | $45,000 | $235,188 |
| 2016 | $7,269 | $272,410 | $40,000 | $232,410 |
| 2015 | $5,811 | $258,600 | $25,000 | $233,600 |
| 2014 | $5,811 | $258,600 | $25,000 | $233,600 |
Source: Public Records
Map
Nearby Homes
- 2244 Hurstview Dr
- 2221 Farrington Ln
- 748 Regency Dr
- 2157 Lookout Ct
- 2620 Brookridge Dr
- 2201 Mountainview Dr
- 712 Springhill Dr
- 617 Indian Trail
- 2741 Naples Dr
- 6400 Rogers Dr
- 500 Quail Cove Ct
- 505 Springhill Dr
- 6350 Rogers Dr
- 753 Toni Dr
- 2838 Summerdale Dr
- 8920 Martin Dr
- 2925 Ridgewood Dr
- 2021 Mountainview Dr
- 9120 Nob Hill Dr
- 6448 Hawks Ridge Dr
- 2648 Bent Tree Dr
- 2640 Bent Tree Dr
- 2652 Bent Tree Dr
- 2636 Bent Tree Dr
- 2637 Bent Tree Dr
- 2633 Bent Tree Dr
- 2641 Bent Tree Dr
- 2656 Bent Tree Dr
- 2632 Bent Tree Dr
- 2629 Bent Tree Dr
- 2660 Bent Tree Dr
- 709 Bent Tree Ct
- 2628 Bent Tree Dr
- 700 Bent Tree Ct
- 2625 Bent Tree Dr
- 704 Bent Tree Ct
- 2620 Briargrove Dr
- 2664 Bent Tree Dr
- 2624 Bent Tree Dr
- 2621 Bent Tree Dr
Your Personal Tour Guide
Ask me questions while you tour the home.