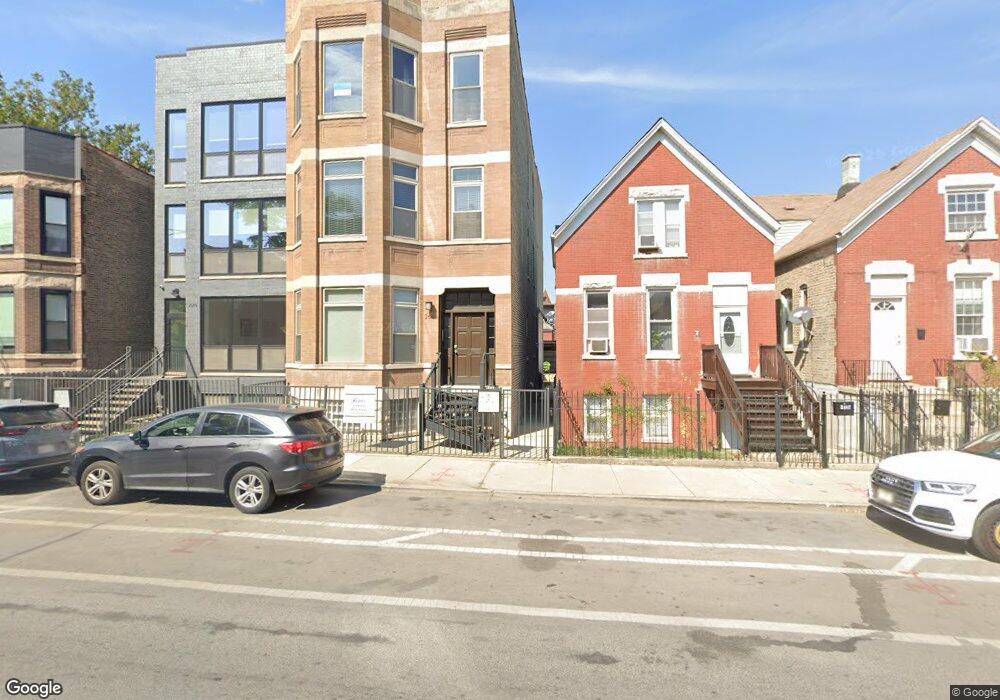
2644 W Augusta Blvd Unit 3 Chicago, IL 60622
Humboldt Park NeighborhoodEstimated Value: $463,513 - $493,000
2
Beds
2
Baths
1,400
Sq Ft
$342/Sq Ft
Est. Value
About This Home
This home is located at 2644 W Augusta Blvd Unit 3, Chicago, IL 60622 and is currently estimated at $478,628, approximately $341 per square foot. 2644 W Augusta Blvd Unit 3 is a home located in Cook County with nearby schools including Chopin Elementary School, Clemente Community Academy High School, and Acero - Esmera Santiago Elementary School.
Ownership History
Date
Name
Owned For
Owner Type
Purchase Details
Closed on
Oct 15, 2021
Sold by
Patlevic Joseph
Bought by
Vasylynyn Nazarii
Current Estimated Value
Home Financials for this Owner
Home Financials are based on the most recent Mortgage that was taken out on this home.
Original Mortgage
$357,750
Outstanding Balance
$326,565
Interest Rate
2.87%
Mortgage Type
New Conventional
Estimated Equity
$152,063
Purchase Details
Closed on
Oct 22, 2015
Sold by
Jeninga Sharon L
Bought by
Patlevic Joseph
Home Financials for this Owner
Home Financials are based on the most recent Mortgage that was taken out on this home.
Original Mortgage
$313,500
Interest Rate
4.25%
Mortgage Type
New Conventional
Purchase Details
Closed on
Aug 29, 2012
Sold by
Augusta Holdings Inc
Bought by
Jeninga Sharon L and The Sharon L Jeninga Trust
Create a Home Valuation Report for This Property
The Home Valuation Report is an in-depth analysis detailing your home's value as well as a comparison with similar homes in the area
Home Values in the Area
Average Home Value in this Area
Purchase History
| Date | Buyer | Sale Price | Title Company |
|---|---|---|---|
| Vasylynyn Nazarii | $397,500 | Ata National Title Group Llc | |
| Patlevic Joseph | $330,000 | Attorney | |
| Jeninga Sharon L | $238,500 | None Available |
Source: Public Records
Mortgage History
| Date | Status | Borrower | Loan Amount |
|---|---|---|---|
| Open | Vasylynyn Nazarii | $357,750 | |
| Previous Owner | Patlevic Joseph | $313,500 |
Source: Public Records
Tax History Compared to Growth
Tax History
| Year | Tax Paid | Tax Assessment Tax Assessment Total Assessment is a certain percentage of the fair market value that is determined by local assessors to be the total taxable value of land and additions on the property. | Land | Improvement |
|---|---|---|---|---|
| 2024 | $6,708 | $37,056 | $5,706 | $31,350 |
| 2023 | $6,498 | $35,013 | $2,598 | $32,415 |
| 2022 | $6,498 | $35,013 | $2,598 | $32,415 |
| 2021 | $6,371 | $35,012 | $2,598 | $32,414 |
| 2020 | $6,647 | $29,838 | $2,598 | $27,240 |
| 2019 | $6,630 | $33,000 | $2,598 | $30,402 |
| 2018 | $6,519 | $33,000 | $2,598 | $30,402 |
| 2017 | $6,262 | $29,089 | $2,292 | $26,797 |
| 2016 | $5,826 | $29,089 | $2,292 | $26,797 |
| 2015 | $5,330 | $29,089 | $2,292 | $26,797 |
| 2014 | $4,259 | $22,955 | $2,037 | $20,918 |
| 2013 | $4,175 | $22,955 | $2,037 | $20,918 |
Source: Public Records
Map
Nearby Homes
- 938 N Washtenaw Ave
- 2651 W Augusta Blvd Unit 3
- 2651 W Augusta Blvd Unit 1
- 929 N Fairfield Ave
- 2647 W Cortez St
- 942 N Fairfield Ave Unit 2W
- 936 N Fairfield Ave
- 2714 W Cortez St Unit 1
- 948 N California Ave
- 841 N Fairfield Ave
- 2554 W Augusta Blvd
- 2708 W Thomas St Unit 2
- 851 N California Ave Unit 4
- 1046 N Rockwell St
- 845 N California Ave Unit 2
- 827 N Fairfield Ave
- 833 N California Ave Unit 1C
- 2649 W Haddon Ave Unit 2S
- 1002 N Mozart St
- 824 N California Ave
- 2644 W Augusta Blvd Unit 2
- 2644 W Augusta Blvd
- 2644 W Augusta Blvd Unit 3
- 2642 W Augusta Blvd
- 2646 W Augusta Blvd
- 2646 W Augusta Blvd Unit 3
- 2646 W Augusta Blvd Unit 1
- 2648 W Augusta Blvd
- 2648 W Augusta Blvd Unit 2
- 2648 W Augusta Blvd
- 2648 W Augusta Blvd
- 2648 W Augusta Blvd Unit G
- 2648 W Augusta Blvd Unit 2R
- 2648 W Augusta Blvd Unit 1R
- 2648 W Augusta Blvd Unit 2F
- 2638 W Augusta Blvd
- 2652 W Augusta Blvd
- 2636 W Augusta Blvd
- 2654 W Augusta Blvd
- 2634 W Augusta Blvd Unit 2