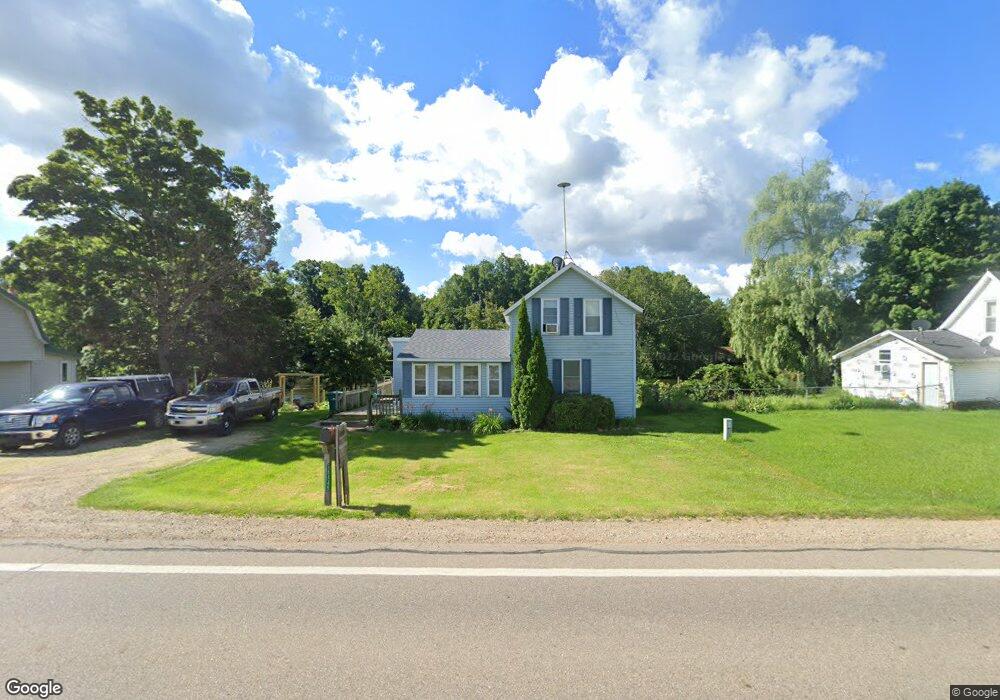
26445 M 60 Mendon, MI 49072
Estimated Value: $166,085 - $209,000
3
Beds
1
Bath
1,474
Sq Ft
$127/Sq Ft
Est. Value
About This Home
This home is located at 26445 M 60, Mendon, MI 49072 and is currently estimated at $186,521, approximately $126 per square foot. 26445 M 60 is a home located in St. Joseph County with nearby schools including Mendon Elementary School and Mendon Middle/High School.
Ownership History
Date
Name
Owned For
Owner Type
Purchase Details
Closed on
Dec 29, 2025
Sold by
Klein Monica Y and Klein Ron
Bought by
Monica Y Klein Revocable Trust and Klein
Current Estimated Value
Purchase Details
Closed on
Dec 1, 2023
Sold by
Maurice L Cupp Trust
Bought by
Switalski Norma Christine
Purchase Details
Closed on
Mar 14, 2007
Sold by
Fannie Mae
Bought by
Klein Ron and Klein Monica
Purchase Details
Closed on
Nov 8, 2006
Sold by
Chase Home Finance Llc
Bought by
Federal National Mortgage Association
Purchase Details
Closed on
Jan 26, 2006
Sold by
Hensley Clifford P and Hensley Joyce A
Bought by
Chase Manhattan Mortgage Corp
Purchase Details
Closed on
May 31, 2001
Sold by
Wood Caundance M
Bought by
Hensley Clifford P
Purchase Details
Closed on
May 29, 2001
Sold by
Hensley Clifford P and Hensley Joyce A
Bought by
Hensley Clifford P and Hensley Joyce A
Purchase Details
Closed on
Oct 5, 1991
Sold by
Richman Calvin R and Richman Patricia A
Bought by
Hensley Clifford P and Hensley Candance M
Create a Home Valuation Report for This Property
The Home Valuation Report is an in-depth analysis detailing your home's value as well as a comparison with similar homes in the area
Purchase History
| Date | Buyer | Sale Price | Title Company |
|---|---|---|---|
| Monica Y Klein Revocable Trust | -- | None Listed On Document | |
| Switalski Norma Christine | -- | None Listed On Document | |
| Cook Pamela L | -- | None Listed On Document | |
| Culp Virginia L | -- | None Listed On Document | |
| Klein Ron | $50,000 | Fidelity National Title | |
| Federal National Mortgage Association | -- | None Available | |
| Chase Manhattan Mortgage Corp | $88,019 | None Available | |
| Hensley Clifford P | -- | -- | |
| Hensley Clifford P | -- | -- | |
| Hensley Clifford P | $59,900 | -- |
Source: Public Records
Tax History
| Year | Tax Paid | Tax Assessment Tax Assessment Total Assessment is a certain percentage of the fair market value that is determined by local assessors to be the total taxable value of land and additions on the property. | Land | Improvement |
|---|---|---|---|---|
| 2025 | $590 | $76,100 | $8,200 | $67,900 |
| 2024 | $574 | $69,000 | $8,200 | $60,800 |
| 2023 | $547 | $59,700 | $7,300 | $52,400 |
| 2022 | $0 | $57,600 | $7,700 | $49,900 |
| 2021 | $1,886 | $59,100 | $8,200 | $50,900 |
| 2020 | $1,328 | $56,300 | $6,100 | $50,200 |
| 2019 | $490 | $55,500 | $6,400 | $49,100 |
| 2018 | $2,210 | $51,700 | $6,400 | $45,300 |
| 2017 | $2,155 | $50,600 | $50,600 | $0 |
| 2016 | -- | $48,300 | $48,300 | $0 |
| 2015 | -- | $47,400 | $0 | $0 |
| 2014 | -- | $44,300 | $44,300 | $0 |
| 2012 | -- | $41,500 | $41,500 | $0 |
Source: Public Records
Map
Nearby Homes
- Lot 04 S Shore Dr
- 226 Pleasant St
- 106 W State St
- 235 N Nottawa St
- 218 W Jackson St
- 228 W Jackson St
- 206 Burr Oak St
- 25660 Simpson Rd
- 865 W Main St
- 30315 Jacksonburg Rd
- 23521 River Run Rd
- 55637 Bennett Rd
- 23317 Michigan Ave
- 54516 Silver St
- 25395 Flach Rd
- 30879 Michigan 60
- 52199 Nancy Ln
- 30725 Orla Engle Rd
- 22533 Davis Dr
- 30311 Michigan 86
Your Personal Tour Guide
Ask me questions while you tour the home.